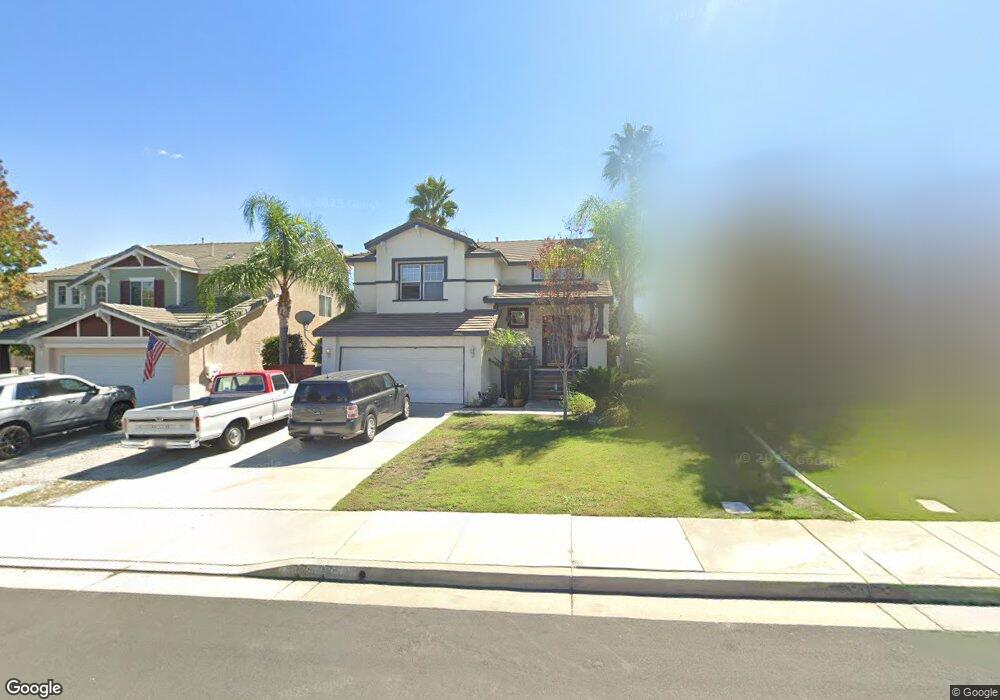
39856 Hillsboro Cir Murrieta, CA 92562
Estimated Value: $568,678 - $704,000
3
Beds
3
Baths
1,708
Sq Ft
$365/Sq Ft
Est. Value
About This Home
This home is located at 39856 Hillsboro Cir, Murrieta, CA 92562 and is currently estimated at $622,920, approximately $364 per square foot. 39856 Hillsboro Cir is a home located in Riverside County with nearby schools including Tovashal Elementary School, Thompson Middle School, and Murrieta Valley High School.
Ownership History
Date
Name
Owned For
Owner Type
Purchase Details
Closed on
Dec 16, 2024
Sold by
Alvarez Gaston A and Henry Theresa Michele
Bought by
Hillsboro Llc
Current Estimated Value
Purchase Details
Closed on
Jul 19, 2016
Sold by
Henry Theresa Michele
Bought by
Alvarez Gaston A and Henry Theresa Michele
Purchase Details
Closed on
Jul 19, 2007
Sold by
Henry Theresa Michele and Alvarez Gaston Alvaro
Bought by
Henry Theresa Michele
Home Financials for this Owner
Home Financials are based on the most recent Mortgage that was taken out on this home.
Original Mortgage
$179,000
Interest Rate
4.5%
Mortgage Type
Credit Line Revolving
Purchase Details
Closed on
Aug 9, 1999
Sold by
Mccune Dev Corp
Bought by
Henry Theresa
Home Financials for this Owner
Home Financials are based on the most recent Mortgage that was taken out on this home.
Original Mortgage
$150,400
Interest Rate
7.69%
Mortgage Type
Balloon
Create a Home Valuation Report for This Property
The Home Valuation Report is an in-depth analysis detailing your home's value as well as a comparison with similar homes in the area
Home Values in the Area
Average Home Value in this Area
Purchase History
| Date | Buyer | Sale Price | Title Company |
|---|---|---|---|
| Hillsboro Llc | -- | None Listed On Document | |
| Hillsboro Llc | -- | None Listed On Document | |
| Alvarez Gaston A | -- | Accommodation | |
| Henry Theresa Michele | -- | Accommodation | |
| Henry Theresa | $188,000 | Fidelity National Title |
Source: Public Records
Mortgage History
| Date | Status | Borrower | Loan Amount |
|---|---|---|---|
| Previous Owner | Henry Theresa Michele | $179,000 | |
| Previous Owner | Henry Theresa | $150,400 | |
| Closed | Henry Theresa | $18,800 |
Source: Public Records
Tax History Compared to Growth
Tax History
| Year | Tax Paid | Tax Assessment Tax Assessment Total Assessment is a certain percentage of the fair market value that is determined by local assessors to be the total taxable value of land and additions on the property. | Land | Improvement |
|---|---|---|---|---|
| 2025 | $3,328 | $288,918 | $61,460 | $227,458 |
| 2023 | $3,328 | $277,701 | $59,074 | $218,627 |
| 2022 | $3,317 | $272,257 | $57,916 | $214,341 |
| 2021 | $3,256 | $266,920 | $56,781 | $210,139 |
| 2020 | $3,225 | $264,184 | $56,199 | $207,985 |
| 2019 | $3,166 | $259,005 | $55,098 | $203,907 |
| 2018 | $3,108 | $253,927 | $54,019 | $199,908 |
| 2017 | $3,068 | $248,949 | $52,960 | $195,989 |
| 2016 | $3,029 | $244,069 | $51,922 | $192,147 |
| 2015 | $2,999 | $240,404 | $51,143 | $189,261 |
| 2014 | $2,864 | $235,697 | $50,143 | $185,554 |
Source: Public Records
Map
Nearby Homes
- 23825 Five Tribes Trail
- 23832 Castinette Way
- 23664 Groveland Place
- 23832 Matador Way
- 39560 Tinderbox Way
- 39634 Cornhusk Cir
- 23825 Matador Way
- 23955 Five Tribes Trail
- 23638 Sonata Dr
- 24026 Crowned Partridge Ln
- 39647 Dartanian Place
- 39785 Spinning Wheel Dr
- 23573 Spindle Way
- 36050 Redgrave Way
- 35944 Wilcox Ln
- 36034 Redgrave Way
- 40311 Via Ambiente
- 40049 Corte Fortuna
- 39668 Nice Ave
- 39944 Spicewood Ave
- 39848 Hillsboro Cir
- 39864 Hillsboro Cir
- 39840 Hillsboro Cir
- 39880 Hillsboro Cir
- 39832 Hillsboro Cir
- 39855 Hillsboro Cir
- 39863 Hillsboro Cir
- 39847 Hillsboro Cir
- 39888 Hillsboro Cir
- 39871 Hillsboro Cir
- 39824 Hillsboro Cir
- 39839 Hillsboro Cir
- 39831 Hillsboro Cir
- 39896 Hillsboro Cir
- 39816 Hillsboro Cir
- 39887 Hillsboro Cir
- 39823 Hillsboro Cir
- 23808 Falconer Dr
- 39808 Hillsboro Cir
- 39895 Hillsboro Cir