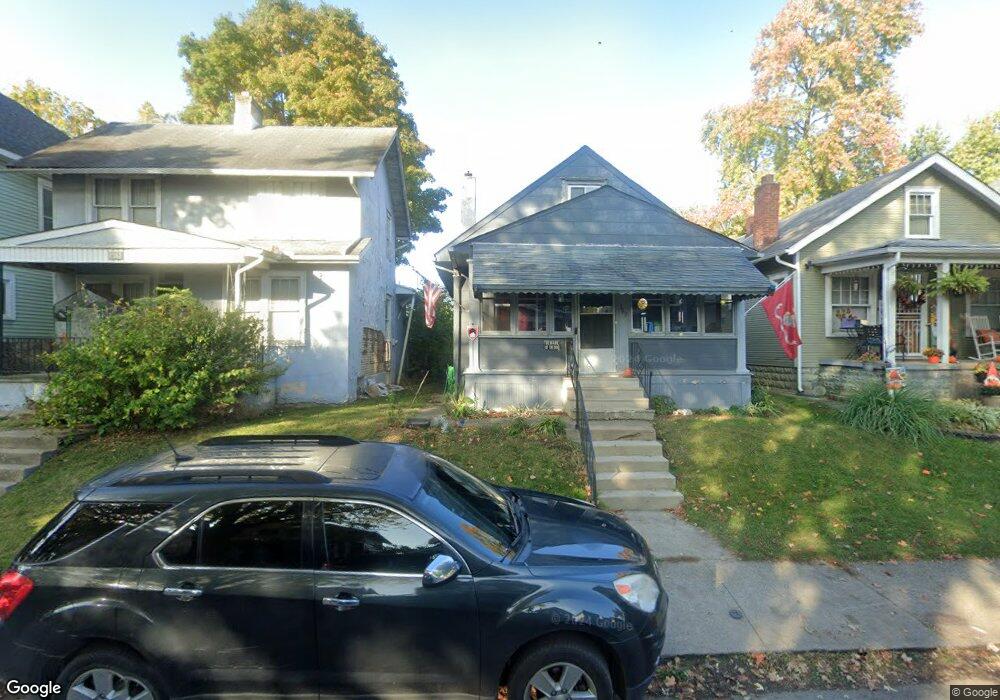
399 S Eureka Ave Columbus, OH 43204
Central Hilltop NeighborhoodEstimated Value: $134,000 - $151,307
3
Beds
1
Bath
1,075
Sq Ft
$134/Sq Ft
Est. Value
About This Home
This home is located at 399 S Eureka Ave, Columbus, OH 43204 and is currently estimated at $144,077, approximately $134 per square foot. 399 S Eureka Ave is a home located in Franklin County with nearby schools including Burroughs Elementary School, Hilltonia Middle School, and Briggs High School.
Ownership History
Date
Name
Owned For
Owner Type
Purchase Details
Closed on
Jun 20, 2024
Sold by
Flores Christopher V
Bought by
Parker Michele E
Current Estimated Value
Home Financials for this Owner
Home Financials are based on the most recent Mortgage that was taken out on this home.
Original Mortgage
$145,000
Outstanding Balance
$142,633
Interest Rate
7.03%
Mortgage Type
New Conventional
Estimated Equity
$1,444
Purchase Details
Closed on
May 22, 2014
Sold by
City Of Columbus Ohio
Bought by
Flores Christopher V
Purchase Details
Closed on
Sep 8, 2010
Sold by
Fannie Mae
Bought by
City Of Columbus
Purchase Details
Closed on
Feb 24, 2010
Sold by
Ho Ros and Sy Soknov
Bought by
Fanniemae and Federal National Mortgage Association
Purchase Details
Closed on
May 28, 2004
Sold by
Nance Carol C and Oyler Debra S
Bought by
Ros Ho and Sy Soknov
Home Financials for this Owner
Home Financials are based on the most recent Mortgage that was taken out on this home.
Original Mortgage
$57,500
Interest Rate
6.06%
Mortgage Type
Purchase Money Mortgage
Purchase Details
Closed on
Jul 30, 1985
Bought by
Nance Carol C
Purchase Details
Closed on
Sep 1, 1983
Create a Home Valuation Report for This Property
The Home Valuation Report is an in-depth analysis detailing your home's value as well as a comparison with similar homes in the area
Home Values in the Area
Average Home Value in this Area
Purchase History
| Date | Buyer | Sale Price | Title Company |
|---|---|---|---|
| Parker Michele E | $155,000 | Landsel Title Agency | |
| Flores Christopher V | -- | None Available | |
| City Of Columbus | -- | Attorney | |
| Fanniemae | $28,000 | Attorney | |
| Ros Ho | $57,500 | -- | |
| Nance Carol C | -- | -- | |
| -- | -- | -- |
Source: Public Records
Mortgage History
| Date | Status | Borrower | Loan Amount |
|---|---|---|---|
| Open | Parker Michele E | $145,000 | |
| Previous Owner | Ros Ho | $57,500 |
Source: Public Records
Tax History
| Year | Tax Paid | Tax Assessment Tax Assessment Total Assessment is a certain percentage of the fair market value that is determined by local assessors to be the total taxable value of land and additions on the property. | Land | Improvement |
|---|---|---|---|---|
| 2025 | $1,346 | $29,370 | $5,360 | $24,010 |
| 2024 | $1,346 | $29,370 | $5,360 | $24,010 |
| 2023 | $1,329 | $29,365 | $5,355 | $24,010 |
| 2022 | $927 | $17,440 | $1,720 | $15,720 |
| 2021 | $928 | $17,440 | $1,720 | $15,720 |
| 2020 | $930 | $17,440 | $1,720 | $15,720 |
| 2019 | $904 | $14,530 | $1,440 | $13,090 |
| 2018 | $909 | $14,530 | $1,440 | $13,090 |
| 2017 | $1,157 | $14,530 | $1,440 | $13,090 |
| 2016 | $1,072 | $14,810 | $4,270 | $10,540 |
| 2015 | $916 | $14,810 | $4,270 | $10,540 |
| 2014 | -- | $14,810 | $4,270 | $10,540 |
| 2013 | -- | $14,805 | $4,270 | $10,535 |
Source: Public Records
Map
Nearby Homes
- 426 S Eureka Ave
- 365-367 S Eureka Ave
- 337 S Wayne Ave
- 461 S Terrace Ave
- 397 S Oakley Ave
- 460 S Richardson Ave
- 309 S Terrace Ave
- 349 S Richardson Ave
- 2397 Sullivant Ave
- 2541 Sullivant Ave Unit 543
- 341 S Wheatland Ave
- 307 S Wheatland Ave
- 346 S Wheatland Ave
- 238 S Richardson Ave
- 350 S Ogden Ave
- 542 S Oakley Ave
- 209 S Terrace Ave
- 365 S Ogden Ave
- 558 S Oakley Ave Unit 60
- 232 S Burgess Ave
- 403 S Eureka Ave
- 395 S Eureka Ave
- 407 S Eureka Ave
- 391 S Eureka Ave
- 387 S Eureka Ave
- 383 S Eureka Ave
- 415 S Eureka Ave
- 417 S Eureka Ave
- 398 S Eureka Ave
- 404 S Eureka Ave
- 396 S Eureka Ave
- 388 S Eureka Ave
- 408 S Eureka Ave
- 392 S Eureka Ave
- 379 S Eureka Ave
- 421 S Eureka Ave
- 384 S Eureka Ave
- 398 S Terrace Ave
- 373 S Eureka Ave Unit 375
- 394 S Terrace Ave
Your Personal Tour Guide
Ask me questions while you tour the home.