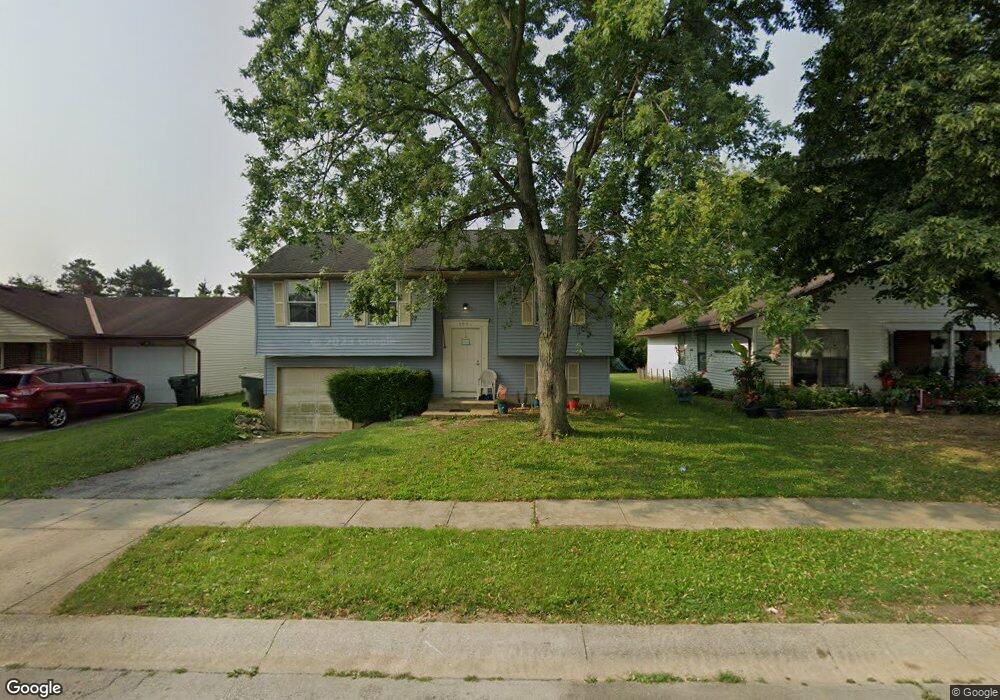
3991 Deer Lake Way Columbus, OH 43204
Brookhollow NeighborhoodEstimated Value: $251,513 - $286,000
3
Beds
2
Baths
996
Sq Ft
$272/Sq Ft
Est. Value
About This Home
This home is located at 3991 Deer Lake Way, Columbus, OH 43204 and is currently estimated at $270,628, approximately $271 per square foot. 3991 Deer Lake Way is a home located in Franklin County with nearby schools including Prairie Lincoln Elementary School, Galloway Ridge Intermediate School, and Norton Middle School.
Ownership History
Date
Name
Owned For
Owner Type
Purchase Details
Closed on
May 13, 2022
Sold by
Snell Mark A
Bought by
Mark A Snell Living Trust
Current Estimated Value
Purchase Details
Closed on
May 3, 2022
Sold by
Snell Mark A
Bought by
Mark A Snell Living Trust
Purchase Details
Closed on
Feb 23, 2022
Sold by
Galbreath Kathryn R
Bought by
Snell Mark A
Purchase Details
Closed on
Feb 8, 2022
Sold by
Galbreath Kathryn R
Bought by
Snell Mark A
Purchase Details
Closed on
Jan 15, 2019
Sold by
Snell Mark A
Bought by
Snell Mark A and Galbreath Kathryn R
Purchase Details
Closed on
Dec 27, 2006
Sold by
Snell Robyn J
Bought by
Snell Mark A
Purchase Details
Closed on
Jun 24, 1982
Bought by
Snell Mark A
Create a Home Valuation Report for This Property
The Home Valuation Report is an in-depth analysis detailing your home's value as well as a comparison with similar homes in the area
Home Values in the Area
Average Home Value in this Area
Purchase History
| Date | Buyer | Sale Price | Title Company |
|---|---|---|---|
| Mark A Snell Living Trust | -- | Milligan Fred J | |
| Mark A Snell Living Trust | -- | Milligan Fred J | |
| Snell Mark A | -- | Milligan Fred J | |
| Snell Mark A | -- | Milligan Fred J | |
| Snell Mark A | -- | None Available | |
| Snell Mark A | -- | Attorney | |
| Snell Mark A | -- | -- |
Source: Public Records
Tax History Compared to Growth
Tax History
| Year | Tax Paid | Tax Assessment Tax Assessment Total Assessment is a certain percentage of the fair market value that is determined by local assessors to be the total taxable value of land and additions on the property. | Land | Improvement |
|---|---|---|---|---|
| 2024 | $3,050 | $81,550 | $31,010 | $50,540 |
| 2023 | $2,997 | $81,550 | $31,010 | $50,540 |
| 2022 | $2,534 | $50,610 | $13,790 | $36,820 |
| 2021 | $3,050 | $50,610 | $13,790 | $36,820 |
| 2020 | $2,676 | $50,610 | $13,790 | $36,820 |
| 2019 | $2,348 | $40,750 | $11,030 | $29,720 |
| 2018 | $2,395 | $40,750 | $11,030 | $29,720 |
| 2017 | $2,329 | $40,750 | $11,030 | $29,720 |
| 2016 | $2,453 | $39,420 | $8,510 | $30,910 |
| 2015 | $2,453 | $39,420 | $8,510 | $30,910 |
| 2014 | $2,455 | $39,420 | $8,510 | $30,910 |
| 2013 | $1,293 | $39,410 | $8,505 | $30,905 |
Source: Public Records
Map
Nearby Homes
- 4000 Sandy Ridge Dr
- 3761 Gibbstone Dr
- 3757 Gibbstone Dr
- 3664 Grimes Dr
- 3570 Dover Rd
- 3495 La Coste Ln
- 4457 Nickerson Rd
- 4451 Sherwill Rd
- 3254 Dover Rd
- 3252 Dover Rd
- 1175 Onaway Ct
- 1150 Romona Place
- 664 N Wilson Rd
- 0 Lowell Dr Unit 223009270
- 2051 Tuckaway Ct
- 3161 Bowdoin Cir
- 3307 Rudon Ln
- 4589 Annhurst Rd
- 2875 Lowell Dr
- 271 Carilla Ln
- 3985 Deer Lake Way
- 3999 Deer Lake Way
- 3979 Deer Lake Way
- 4007 Deer Lake Way
- 4013 Deer Lake Way
- 3973 Deer Lake Way
- 3988 Deer Lake Way
- 3996 Deer Lake Way
- 3967 Deer Lake Way
- 4019 Deer Lake Way
- 3980 Deer Lake Way
- 1261 Deer Lake Ct
- 3961 Deer Lake Way
- 1273 Winesap Dr
- 4025 Deer Lake Way
- 1276 Winesap Dr
- 4018 Deer Lake Way
- 3953 Deer Lake Way
- 1269 Deer Lake Ct
- 1256 Deer Lake Ct