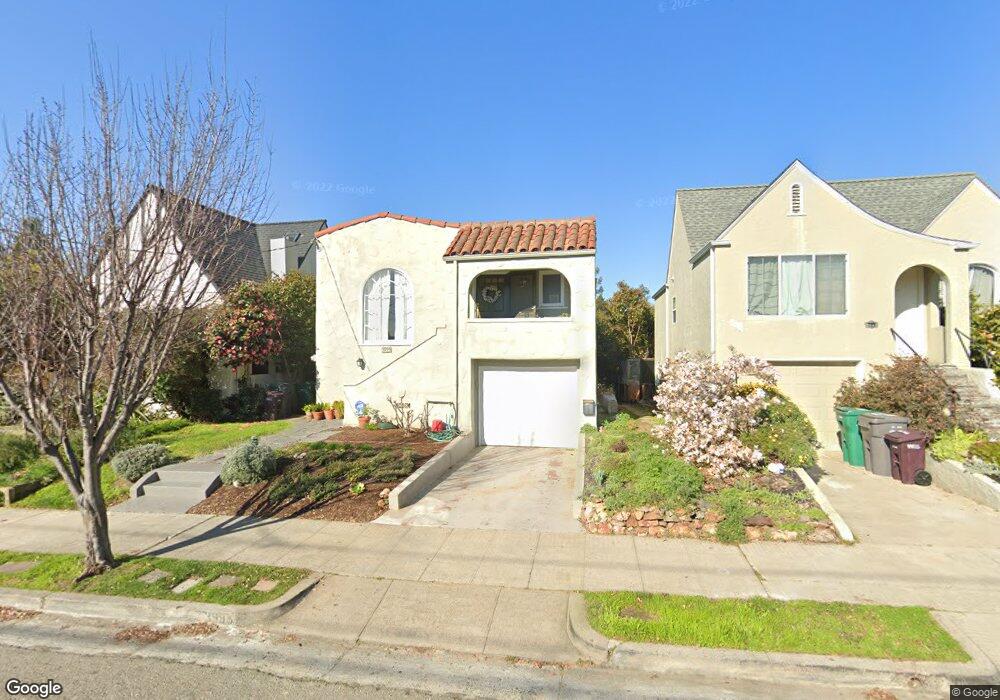
3995 Forest Hill Ave Oakland, CA 94602
Oakmore NeighborhoodEstimated Value: $877,000 - $990,175
3
Beds
2
Baths
1,604
Sq Ft
$583/Sq Ft
Est. Value
About This Home
This home is located at 3995 Forest Hill Ave, Oakland, CA 94602 and is currently estimated at $935,794, approximately $583 per square foot. 3995 Forest Hill Ave is a home located in Alameda County with nearby schools including Sequoia Elementary School, Bret Harte Middle School, and Skyline High School.
Ownership History
Date
Name
Owned For
Owner Type
Purchase Details
Closed on
May 29, 2014
Sold by
Huff Janet R
Bought by
Huff Janet R and Janet R Huff Revocable Trust
Current Estimated Value
Purchase Details
Closed on
Jan 9, 2012
Sold by
Huff Huff Janet R Janet R and Huff Vax Janet
Bought by
Huff Janet R
Home Financials for this Owner
Home Financials are based on the most recent Mortgage that was taken out on this home.
Original Mortgage
$395,500
Interest Rate
3.93%
Mortgage Type
New Conventional
Purchase Details
Closed on
Oct 7, 2010
Sold by
Vax Joseph R
Bought by
Vax Janet Huff
Home Financials for this Owner
Home Financials are based on the most recent Mortgage that was taken out on this home.
Original Mortgage
$400,000
Interest Rate
3.62%
Mortgage Type
New Conventional
Create a Home Valuation Report for This Property
The Home Valuation Report is an in-depth analysis detailing your home's value as well as a comparison with similar homes in the area
Home Values in the Area
Average Home Value in this Area
Purchase History
| Date | Buyer | Sale Price | Title Company |
|---|---|---|---|
| Huff Janet R | -- | None Available | |
| Huff Janet R | -- | First American Title Company | |
| Vax Janet Huff | -- | Chicago Title |
Source: Public Records
Mortgage History
| Date | Status | Borrower | Loan Amount |
|---|---|---|---|
| Closed | Huff Janet R | $395,500 | |
| Closed | Vax Janet Huff | $400,000 |
Source: Public Records
Tax History Compared to Growth
Tax History
| Year | Tax Paid | Tax Assessment Tax Assessment Total Assessment is a certain percentage of the fair market value that is determined by local assessors to be the total taxable value of land and additions on the property. | Land | Improvement |
|---|---|---|---|---|
| 2025 | $4,532 | $236,741 | $167,424 | $76,317 |
| 2024 | $4,532 | $231,963 | $164,142 | $74,821 |
| 2023 | $4,676 | $234,278 | $160,924 | $73,354 |
| 2022 | $4,494 | $222,685 | $157,769 | $71,916 |
| 2021 | $4,174 | $218,181 | $154,675 | $70,506 |
| 2020 | $4,123 | $222,873 | $153,090 | $69,783 |
| 2019 | $3,888 | $218,503 | $150,088 | $68,415 |
| 2018 | $3,804 | $214,220 | $147,146 | $67,074 |
| 2017 | $3,622 | $210,020 | $144,261 | $65,759 |
| 2016 | $3,547 | $205,903 | $141,433 | $64,470 |
| 2015 | $3,644 | $202,810 | $139,309 | $63,501 |
| 2014 | $3,604 | $198,838 | $136,580 | $62,258 |
Source: Public Records
Map
Nearby Homes
- 3887 Forest Hill Ave
- 3847 Fruitvale Ave
- 3826 Lincoln Ave
- 2436 Potomac St
- 2510 Delmer St
- 4081 Waterhouse Rd
- 4224 Lincoln Ave
- 2471 Burlington St
- 3853 Rhoda Ave
- 4271 Whittle Ave
- 1989 Oakview Dr
- 4019 Rhoda Ave
- 1975 Wrenn St
- 3875 Coolidge Ave
- 3873 Coolidge Ave
- 2726 Madeline St
- 2808 Carmel St
- 2240 Macarthur Blvd
- 3541 Dimond Ave
- 1200 El Centro Ave
- 4007 Forest Hill Ave
- 3989 Forest Hill Ave
- 4015 Forest Hill Ave
- 3987 Forest Hill Ave
- 3982 Fruitvale Ave
- 3976 Fruitvale Ave
- 3990 Fruitvale Ave
- 4023 Forest Hill Ave
- 4000 Fruitvale Ave
- 3983 Forest Hill Ave
- 3972 Fruitvale Ave
- 3968 Fruitvale Ave
- 4000 Forest Hill Ave
- 4031 Forest Hill Ave
- 3979 Forest Hill Ave
- 4012 Forest Hill Ave
- 3978 Forest Hill Ave
- 4004 Fruitvale Ave
- 3990 Forest Hill Ave
- 3996 Forest Hill Ave