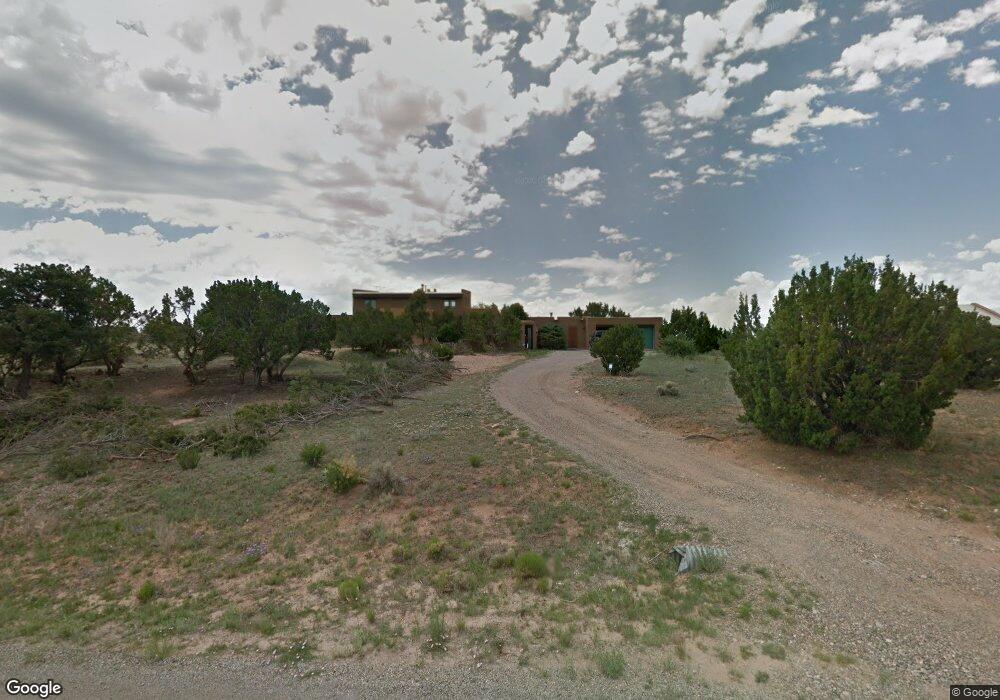
4 Azul Loop Santa Fe, NM 87508
Eldorado at Santa Fe NeighborhoodEstimated Value: $882,000 - $969,000
4
Beds
3
Baths
3,590
Sq Ft
$260/Sq Ft
Est. Value
About This Home
This home is located at 4 Azul Loop, Santa Fe, NM 87508 and is currently estimated at $932,252, approximately $259 per square foot. 4 Azul Loop is a home located in Santa Fe County with nearby schools including El Dorado Community School and Santa Fe High School.
Ownership History
Date
Name
Owned For
Owner Type
Purchase Details
Closed on
Oct 27, 2016
Sold by
Henderson Norma F
Bought by
Hall Jay R and Hall Annie
Current Estimated Value
Purchase Details
Closed on
May 6, 2014
Sold by
Albeck Georg M and Albeck Melissa J
Bought by
Henderson Norma F
Home Financials for this Owner
Home Financials are based on the most recent Mortgage that was taken out on this home.
Original Mortgage
$300,000
Interest Rate
4.46%
Mortgage Type
New Conventional
Purchase Details
Closed on
Aug 20, 2001
Sold by
Reinwald Mark and Reinwald Stella
Bought by
Albeck Georg M and Albeck Melissa J
Home Financials for this Owner
Home Financials are based on the most recent Mortgage that was taken out on this home.
Original Mortgage
$224,000
Interest Rate
7.14%
Purchase Details
Closed on
Feb 15, 2000
Sold by
Quade Leslie
Bought by
Quade David J
Create a Home Valuation Report for This Property
The Home Valuation Report is an in-depth analysis detailing your home's value as well as a comparison with similar homes in the area
Home Values in the Area
Average Home Value in this Area
Purchase History
| Date | Buyer | Sale Price | Title Company |
|---|---|---|---|
| Hall Jay R | -- | Fidelity National Title Ins | |
| Henderson Norma F | -- | None Available | |
| Albeck Georg M | -- | Territorial Abstract & Title | |
| Quade David J | -- | -- |
Source: Public Records
Mortgage History
| Date | Status | Borrower | Loan Amount |
|---|---|---|---|
| Previous Owner | Henderson Norma F | $300,000 | |
| Previous Owner | Albeck Georg M | $224,000 |
Source: Public Records
Tax History
| Year | Tax Paid | Tax Assessment Tax Assessment Total Assessment is a certain percentage of the fair market value that is determined by local assessors to be the total taxable value of land and additions on the property. | Land | Improvement |
|---|---|---|---|---|
| 2025 | $3,468 | $500,091 | $76,046 | $424,045 |
| 2024 | $3,396 | $485,527 | $73,832 | $411,695 |
| 2023 | $3,400 | $471,386 | $71,682 | $399,704 |
| 2022 | $3,313 | $457,658 | $69,595 | $388,063 |
| 2021 | $3,249 | $148,110 | $22,522 | $125,588 |
| 2020 | $3,178 | $143,796 | $21,866 | $121,930 |
| 2019 | $3,115 | $139,608 | $21,866 | $117,742 |
| 2018 | $3,034 | $135,542 | $21,866 | $113,676 |
| 2017 | $2,930 | $131,594 | $21,866 | $109,728 |
| 2016 | $2,496 | $115,943 | $26,880 | $89,063 |
| 2015 | $2,448 | $112,567 | $26,880 | $85,687 |
| 2014 | $2,431 | $114,499 | $21,522 | $92,977 |
Source: Public Records
Map
Nearby Homes
- 71 Camerada Loop
- 32 Lucero Rd Unit A-B
- 7 Hidalgo Ct
- 10 Cerrado Rd
- 4 Cerrado Loop
- 5 Dovela Place
- 14 Jornada Ct
- 1 Antigua Rd
- 16 Antigua Rd
- 3 Dovela Ct
- 4 Herrada Ct
- 39 Monterey Rd
- 10 Carlito Rd
- 8 Carlito Rd
- 3 Solano Ct
- 40 Camino Oriente
- 20 Avenida Del Monte Alto
- 16 Cuesta Rd
- 33 Moya Loop
- 68 Avenida Las Nubes
Your Personal Tour Guide
Ask me questions while you tour the home.