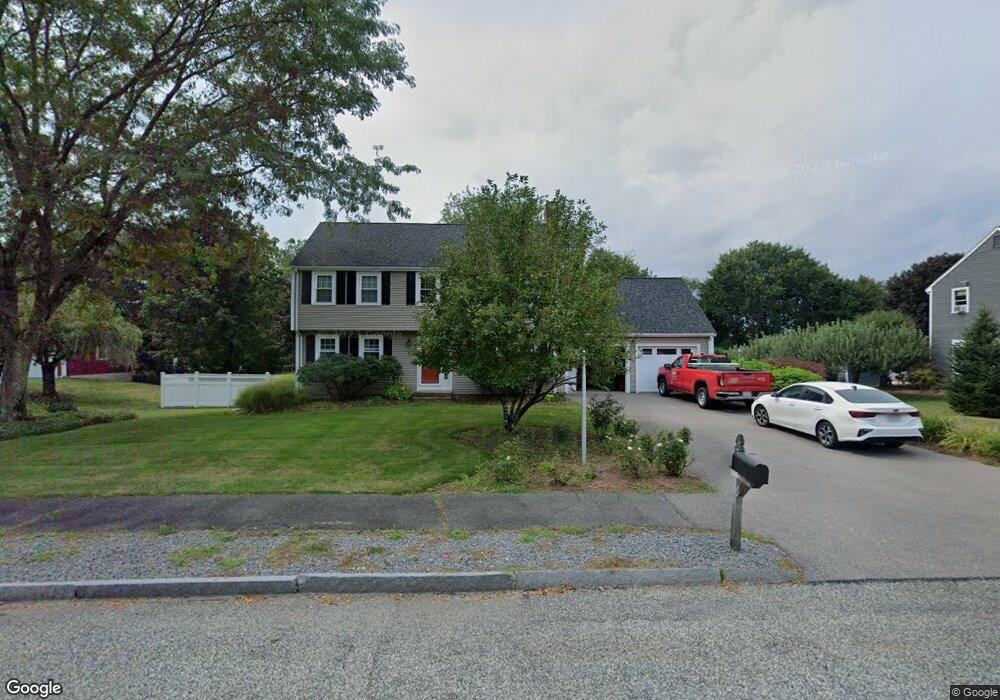
4 Berkeley Dr Franklin, MA 02038
Estimated Value: $692,789 - $742,000
3
Beds
2
Baths
1,818
Sq Ft
$394/Sq Ft
Est. Value
About This Home
This home is located at 4 Berkeley Dr, Franklin, MA 02038 and is currently estimated at $715,447, approximately $393 per square foot. 4 Berkeley Dr is a home located in Norfolk County with nearby schools including Helen Keller Elementary School, Annie Sullivan Middle School, and Franklin High School.
Ownership History
Date
Name
Owned For
Owner Type
Purchase Details
Closed on
Mar 19, 2021
Sold by
Stackpole Michael H and Stackpole Jacqueline R
Bought by
Stackpole Ft
Current Estimated Value
Create a Home Valuation Report for This Property
The Home Valuation Report is an in-depth analysis detailing your home's value as well as a comparison with similar homes in the area
Purchase History
| Date | Buyer | Sale Price | Title Company |
|---|---|---|---|
| Stackpole Ft | -- | None Available |
Source: Public Records
Tax History
| Year | Tax Paid | Tax Assessment Tax Assessment Total Assessment is a certain percentage of the fair market value that is determined by local assessors to be the total taxable value of land and additions on the property. | Land | Improvement |
|---|---|---|---|---|
| 2025 | $7,500 | $645,400 | $328,900 | $316,500 |
| 2024 | $7,241 | $614,200 | $328,900 | $285,300 |
| 2023 | $7,183 | $571,000 | $285,700 | $285,300 |
| 2022 | $6,587 | $468,800 | $216,400 | $252,400 |
| 2021 | $6,626 | $452,300 | $240,500 | $211,800 |
| 2020 | $6,187 | $426,400 | $224,600 | $201,800 |
| 2019 | $6,055 | $413,000 | $216,700 | $196,300 |
| 2018 | $5,696 | $388,800 | $212,700 | $176,100 |
| 2017 | $5,466 | $374,900 | $198,800 | $176,100 |
| 2016 | $5,433 | $374,700 | $201,500 | $173,200 |
| 2015 | $5,483 | $369,500 | $196,300 | $173,200 |
| 2014 | $4,991 | $345,400 | $172,200 | $173,200 |
Source: Public Records
Map
Nearby Homes
- 29 Elm St
- 8 Woodhaven Dr
- 839 Lincoln St
- 48 Dover Cir
- 253 Village St
- 29 Hancock Rd
- 254 Daniels St
- 14 Sanford St Unit 47
- 27 Dover Cir
- 24 Leanne Way Unit 24
- 83 Oliver Pond Cir Unit 7
- 91 Oliver Pond Cir Unit 3
- 20 Broad St Unit 1
- 20 Broad St Unit 6
- 20 Broad St Unit A
- 20 Broad St Unit 4
- 72 Skyline Dr
- 10 Barber St
- 100 Daniels St
- 58 Holliston St
Your Personal Tour Guide
Ask me questions while you tour the home.