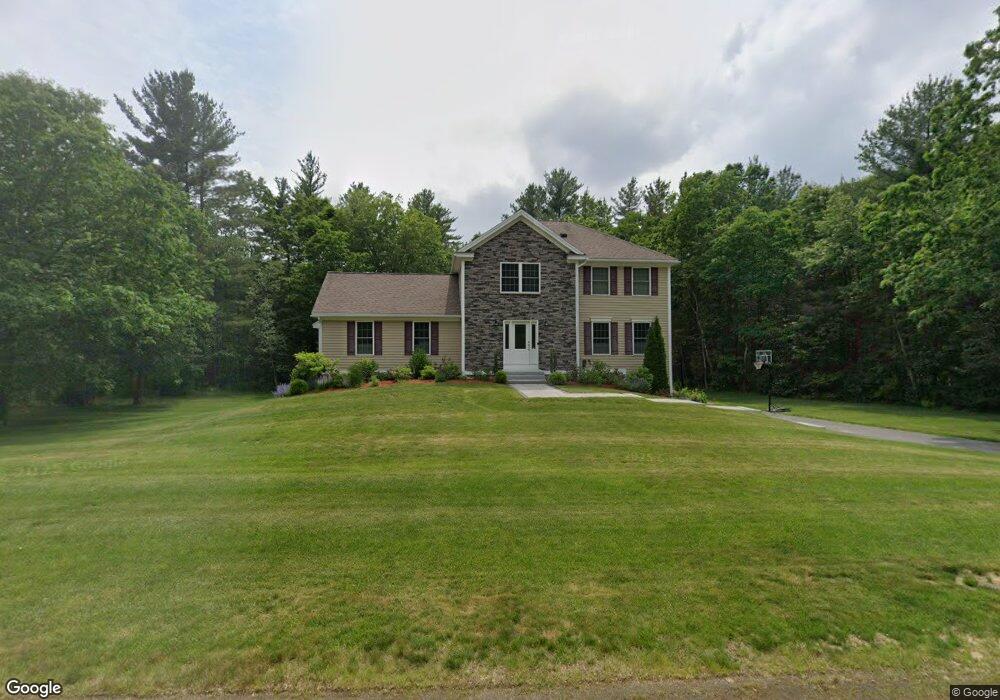
4 Blackbird Ln Litchfield, NH 03052
Estimated Value: $637,000 - $840,000
3
Beds
3
Baths
2,724
Sq Ft
$264/Sq Ft
Est. Value
About This Home
This home is located at 4 Blackbird Ln, Litchfield, NH 03052 and is currently estimated at $718,754, approximately $263 per square foot. 4 Blackbird Ln is a home with nearby schools including Griffin Memorial School and Tabernacle Christian School.
Ownership History
Date
Name
Owned For
Owner Type
Purchase Details
Closed on
Jul 28, 2020
Sold by
Zapanas Craig M and Zapenas Craig M
Bought by
Zapanas Craig M and Zapanas Tanya
Current Estimated Value
Purchase Details
Closed on
Feb 2, 2009
Sold by
Sanborn Development Ll
Bought by
Zapenas Craig M and Zapenas Tanya
Home Financials for this Owner
Home Financials are based on the most recent Mortgage that was taken out on this home.
Original Mortgage
$369,138
Interest Rate
5.28%
Mortgage Type
Purchase Money Mortgage
Create a Home Valuation Report for This Property
The Home Valuation Report is an in-depth analysis detailing your home's value as well as a comparison with similar homes in the area
Home Values in the Area
Average Home Value in this Area
Purchase History
| Date | Buyer | Sale Price | Title Company |
|---|---|---|---|
| Zapanas Craig M | -- | None Available | |
| Zapenas Craig M | $376,900 | -- |
Source: Public Records
Mortgage History
| Date | Status | Borrower | Loan Amount |
|---|---|---|---|
| Previous Owner | Zapenas Craig M | $374,675 | |
| Previous Owner | Zapenas Craig M | $369,138 |
Source: Public Records
Tax History Compared to Growth
Tax History
| Year | Tax Paid | Tax Assessment Tax Assessment Total Assessment is a certain percentage of the fair market value that is determined by local assessors to be the total taxable value of land and additions on the property. | Land | Improvement |
|---|---|---|---|---|
| 2024 | $9,889 | $475,900 | $180,500 | $295,400 |
| 2023 | $9,965 | $475,900 | $180,500 | $295,400 |
| 2022 | $8,860 | $465,600 | $180,500 | $285,100 |
| 2021 | $8,586 | $465,600 | $180,500 | $285,100 |
| 2020 | $8,558 | $460,600 | $180,500 | $280,100 |
| 2019 | $8,384 | $354,500 | $138,600 | $215,900 |
| 2017 | $7,889 | $350,800 | $138,600 | $212,200 |
| 2016 | $7,577 | $350,800 | $138,600 | $212,200 |
| 2015 | $7,149 | $350,800 | $138,600 | $212,200 |
| 2014 | $7,247 | $350,100 | $138,400 | $211,700 |
| 2013 | $7,202 | $350,100 | $138,400 | $211,700 |
Source: Public Records
Map
Nearby Homes
- 22 Cardinal Ln
- 12 Louise Dr
- 31 Page Rd Unit 20
- 11 Rotterdam Dr
- 36 Charles Bancroft Hwy
- 11 Bradford Ln
- 18 Tallarico St Unit Lot 23
- 5 Talent Rd Unit 29-2
- 7 Talent Rd Unit 7/29-2
- 8 Acadia Dr
- 1 Cobbler Ct
- 9 Plaza Ave
- 7A Kingston Way Unit A
- 3 Acadia Dr Unit 2-7
- 27 Alvirne Dr
- 4 Sunset Dr Unit A
- 16 Evergreen Dr
- 4 Quincy Rd
- 4 Quincy Rd Unit A
- 3 Robin Dr