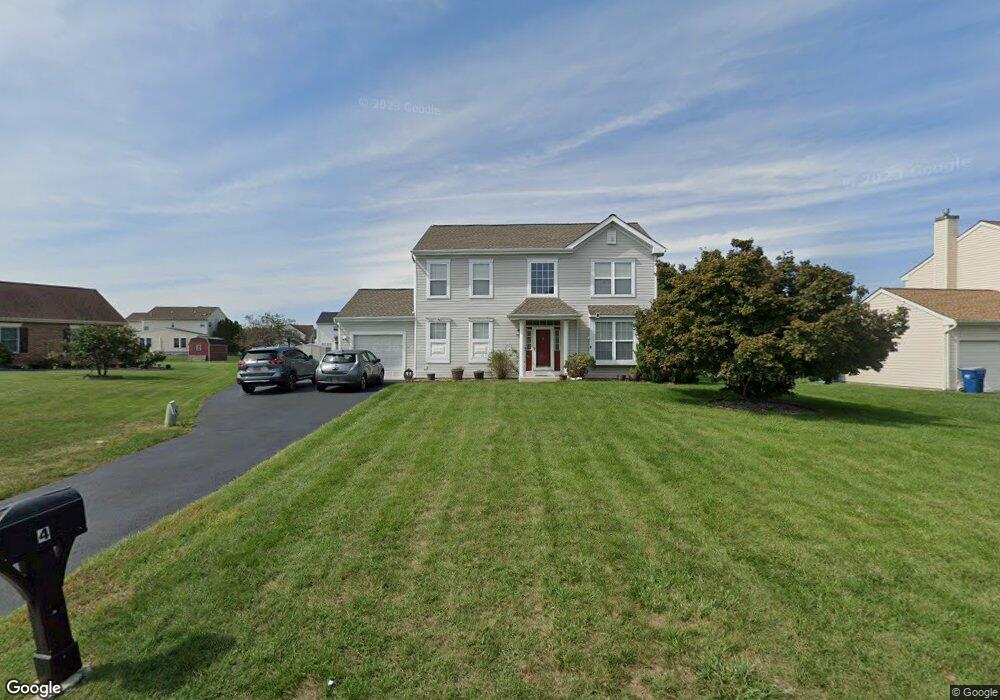
4 Burdock Ct New Castle, DE 19720
Estimated Value: $426,000 - $521,000
3
Beds
3
Baths
2,184
Sq Ft
$213/Sq Ft
Est. Value
About This Home
This home is located at 4 Burdock Ct, New Castle, DE 19720 and is currently estimated at $464,618, approximately $212 per square foot. 4 Burdock Ct is a home located in New Castle County with nearby schools including Southern Elementary School, Gunning Bedford Middle School, and Delaware Valley Classical School.
Ownership History
Date
Name
Owned For
Owner Type
Purchase Details
Closed on
Jan 26, 2007
Sold by
Lamb Lester R
Bought by
Lamb Lester R and Lamb Robin C
Current Estimated Value
Home Financials for this Owner
Home Financials are based on the most recent Mortgage that was taken out on this home.
Original Mortgage
$248,000
Outstanding Balance
$148,541
Interest Rate
6.16%
Mortgage Type
New Conventional
Estimated Equity
$316,077
Purchase Details
Closed on
Nov 30, 2005
Sold by
Augustine Michael and Augustine Garfield D
Bought by
Lamb Lester R
Home Financials for this Owner
Home Financials are based on the most recent Mortgage that was taken out on this home.
Original Mortgage
$145,000
Interest Rate
6.14%
Mortgage Type
Fannie Mae Freddie Mac
Create a Home Valuation Report for This Property
The Home Valuation Report is an in-depth analysis detailing your home's value as well as a comparison with similar homes in the area
Home Values in the Area
Average Home Value in this Area
Purchase History
| Date | Buyer | Sale Price | Title Company |
|---|---|---|---|
| Lamb Lester R | -- | None Available | |
| Lamb Lester R | $295,000 | -- |
Source: Public Records
Mortgage History
| Date | Status | Borrower | Loan Amount |
|---|---|---|---|
| Open | Lamb Lester R | $248,000 | |
| Closed | Lamb Lester R | $145,000 |
Source: Public Records
Tax History Compared to Growth
Tax History
| Year | Tax Paid | Tax Assessment Tax Assessment Total Assessment is a certain percentage of the fair market value that is determined by local assessors to be the total taxable value of land and additions on the property. | Land | Improvement |
|---|---|---|---|---|
| 2024 | $2,542 | $73,100 | $13,700 | $59,400 |
| 2023 | $2,324 | $73,100 | $13,700 | $59,400 |
| 2022 | $2,420 | $73,100 | $13,700 | $59,400 |
| 2021 | $2,419 | $73,100 | $13,700 | $59,400 |
| 2020 | $2,434 | $73,100 | $13,700 | $59,400 |
| 2019 | $2,635 | $73,100 | $13,700 | $59,400 |
| 2018 | $2,395 | $73,100 | $13,700 | $59,400 |
| 2017 | $2,244 | $73,100 | $13,700 | $59,400 |
| 2016 | $2,000 | $73,100 | $13,700 | $59,400 |
| 2015 | $2,000 | $73,100 | $13,700 | $59,400 |
| 2014 | $2,011 | $73,100 | $13,700 | $59,400 |
Source: Public Records
Map
Nearby Homes
- 405 Park Ave
- 207 Rolling Green Ave
- 12 Bancroft Rd
- 10 Holden Dr
- 102 4th Ave
- 555 Arrowgrass Ln
- 553 Arrowgrass Ln
- 551 Arrowgrass Ln
- 22 E Balbach Ave
- Maverick Plan at Riverbend
- 548 Arrowgrass Ln
- 46 Holden Dr
- 544 Arrowgrass Ln
- 24 Ashley Dr
- 64 Holden Dr
- 7 Brian Ct
- 1209 Canvasback Dr
- 5 Liborio Ln
- 216 Highland Blvd Unit 77
- 218 Highland Blvd Unit 67