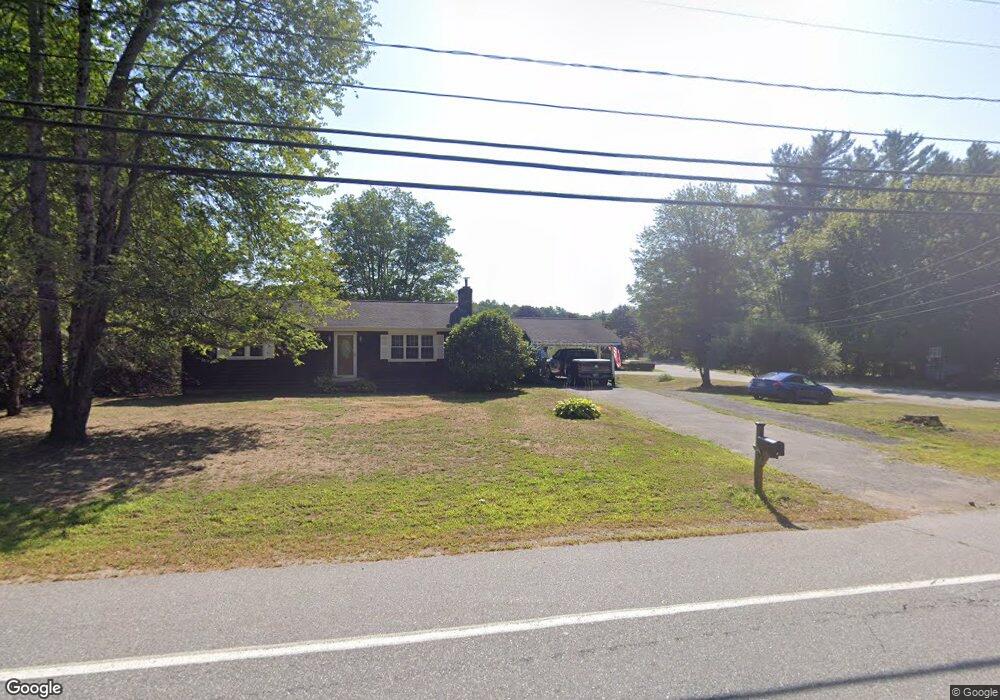
4 Chisholm Rd Kingston, NH 03848
Estimated Value: $512,619 - $547,000
2
Beds
2
Baths
1,506
Sq Ft
$349/Sq Ft
Est. Value
About This Home
This home is located at 4 Chisholm Rd, Kingston, NH 03848 and is currently estimated at $526,155, approximately $349 per square foot. 4 Chisholm Rd is a home located in Rockingham County with nearby schools including Daniel J. Bakie School, Sanborn Regional Middle School, and Sanborn Regional High School.
Ownership History
Date
Name
Owned For
Owner Type
Purchase Details
Closed on
Sep 8, 2023
Sold by
Bond Mitchell L and Bond Therese
Bought by
Bond
Current Estimated Value
Purchase Details
Closed on
Feb 25, 2000
Sold by
Wooster Brent C and Wooster Annie K
Bought by
Bond Mitchell L and Bond Therese
Purchase Details
Closed on
Nov 12, 1999
Sold by
Degruttola Jason W and Degruttola Jennifer E
Bought by
Wooster Brent C and Wooster Amie K
Purchase Details
Closed on
Jun 1, 1998
Sold by
Ippolito Frank R and Ippolito Maureen B
Bought by
Degruttola Jason W and Degruttola Jennifer E
Create a Home Valuation Report for This Property
The Home Valuation Report is an in-depth analysis detailing your home's value as well as a comparison with similar homes in the area
Home Values in the Area
Average Home Value in this Area
Purchase History
| Date | Buyer | Sale Price | Title Company |
|---|---|---|---|
| Bond | -- | None Available | |
| Bond Mitchell L | $160,900 | -- | |
| Wooster Brent C | $156,900 | -- | |
| Degruttola Jason W | $140,000 | -- |
Source: Public Records
Mortgage History
| Date | Status | Borrower | Loan Amount |
|---|---|---|---|
| Previous Owner | Degruttola Jason W | $160,225 | |
| Previous Owner | Degruttola Jason W | $170,800 | |
| Previous Owner | Degruttola Jason W | $160,000 |
Source: Public Records
Tax History Compared to Growth
Tax History
| Year | Tax Paid | Tax Assessment Tax Assessment Total Assessment is a certain percentage of the fair market value that is determined by local assessors to be the total taxable value of land and additions on the property. | Land | Improvement |
|---|---|---|---|---|
| 2024 | $6,416 | $386,300 | $131,500 | $254,800 |
| 2023 | $6,096 | $386,300 | $131,500 | $254,800 |
| 2022 | $5,389 | $237,300 | $85,900 | $151,400 |
| 2020 | $4,905 | $234,900 | $85,900 | $149,000 |
| 2019 | $5,168 | $234,900 | $85,900 | $149,000 |
| 2018 | $4,942 | $234,900 | $85,900 | $149,000 |
| 2017 | $4,924 | $191,000 | $78,000 | $113,000 |
| 2016 | $4,871 | $191,000 | $78,000 | $113,000 |
| 2015 | $4,955 | $191,000 | $78,000 | $113,000 |
| 2014 | $5,160 | $204,600 | $78,000 | $126,600 |
| 2013 | $4,968 | $204,600 | $78,000 | $126,600 |
Source: Public Records
Map
Nearby Homes