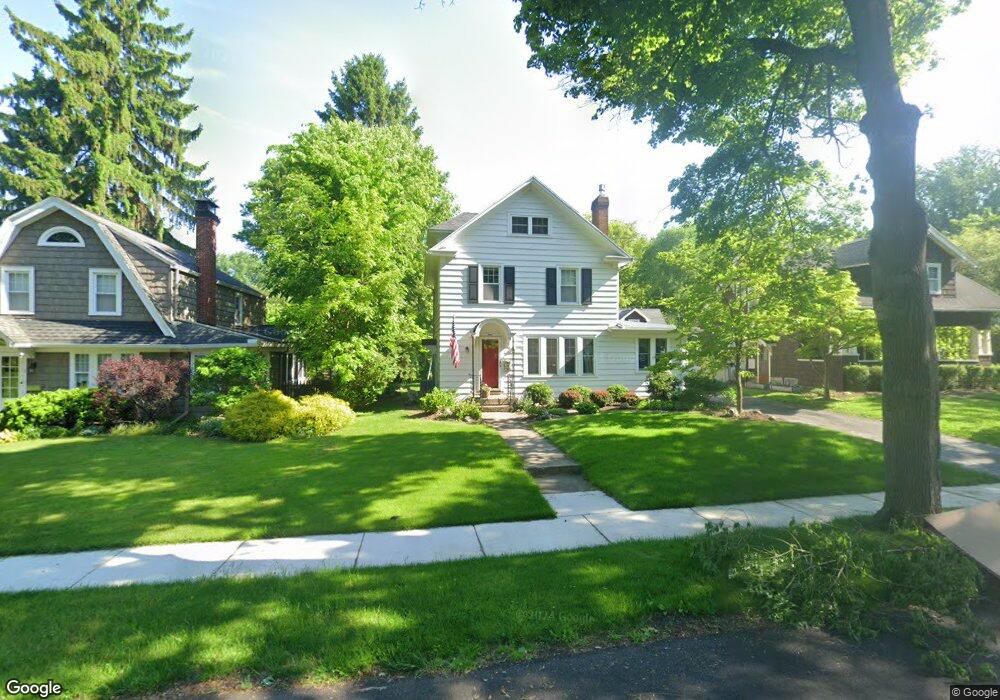
4 Clifford St Fairport, NY 14450
Estimated Value: $328,000 - $396,000
3
Beds
1
Bath
1,417
Sq Ft
$261/Sq Ft
Est. Value
About This Home
This home is located at 4 Clifford St, Fairport, NY 14450 and is currently estimated at $370,363, approximately $261 per square foot. 4 Clifford St is a home located in Monroe County with nearby schools including Jefferson Avenue Elementary School, Minerva Deland School, and Johanna Perrin Middle School.
Ownership History
Date
Name
Owned For
Owner Type
Purchase Details
Closed on
Jun 4, 2007
Sold by
Friden Charles B
Bought by
Mason Brent
Current Estimated Value
Purchase Details
Closed on
Apr 29, 2005
Sold by
Jones Daniel
Bought by
Friden Charles
Home Financials for this Owner
Home Financials are based on the most recent Mortgage that was taken out on this home.
Original Mortgage
$120,000
Interest Rate
6.05%
Mortgage Type
New Conventional
Purchase Details
Closed on
Oct 15, 2004
Sold by
Mobility Cendant
Bought by
Jones Daniel L
Purchase Details
Closed on
Sep 22, 2004
Sold by
Cackett Paul E
Bought by
Mobility Cendant
Purchase Details
Closed on
Jan 26, 2001
Sold by
Ulmer Theophilus L
Bought by
Cackett Paul E
Purchase Details
Closed on
Nov 3, 1995
Sold by
Ashbaugh Douglas and Ashbaugh Nancy
Bought by
Ulmer Theophilus L and Ulmer Andrea L
Create a Home Valuation Report for This Property
The Home Valuation Report is an in-depth analysis detailing your home's value as well as a comparison with similar homes in the area
Home Values in the Area
Average Home Value in this Area
Purchase History
| Date | Buyer | Sale Price | Title Company |
|---|---|---|---|
| Mason Brent | $173,000 | William P Fletch | |
| Friden Charles | $166,000 | -- | |
| Jones Daniel L | $169,000 | -- | |
| Mobility Cendant | $169,000 | -- | |
| Cackett Paul E | $135,000 | Robert Place | |
| Ulmer Theophilus L | $115,000 | -- |
Source: Public Records
Mortgage History
| Date | Status | Borrower | Loan Amount |
|---|---|---|---|
| Previous Owner | Friden Charles | $120,000 |
Source: Public Records
Tax History Compared to Growth
Tax History
| Year | Tax Paid | Tax Assessment Tax Assessment Total Assessment is a certain percentage of the fair market value that is determined by local assessors to be the total taxable value of land and additions on the property. | Land | Improvement |
|---|---|---|---|---|
| 2024 | $9,627 | $212,000 | $45,000 | $167,000 |
| 2023 | $9,748 | $192,200 | $45,000 | $147,200 |
| 2022 | $8,578 | $192,200 | $45,000 | $147,200 |
| 2021 | $8,584 | $192,200 | $45,000 | $147,200 |
| 2020 | $7,764 | $192,200 | $45,000 | $147,200 |
| 2019 | $5,673 | $192,200 | $31,500 | $160,700 |
| 2018 | $7,334 | $192,200 | $31,500 | $160,700 |
| 2017 | $3,550 | $178,000 | $31,500 | $146,500 |
| 2016 | $5,673 | $178,000 | $31,500 | $146,500 |
| 2015 | -- | $178,000 | $31,500 | $146,500 |
| 2014 | -- | $178,000 | $31,500 | $146,500 |
Source: Public Records
Map
Nearby Homes
- 112 Roselawn Ave
- 3 Packetts Glen
- 31 Dewey Ave
- 105 Packetts Glen
- 12 Deland Park A
- 10 Lonesome Rd
- 70 High St
- 158 N Main St
- 24 Lisand Dr
- 76 - 78 Summit St
- 27-8 Great Wood Ct Unit 8
- 4 Niblick Ct
- 73 Clarkes Crossing
- 418 Jefferson Ave
- 603 Watson Rd
- 457 Jefferson Ave
- 15 Whitney Farms Cir
- 375 Whitney Rd
- 14 Peppermill Dr
- 294 Ridgeview Dr