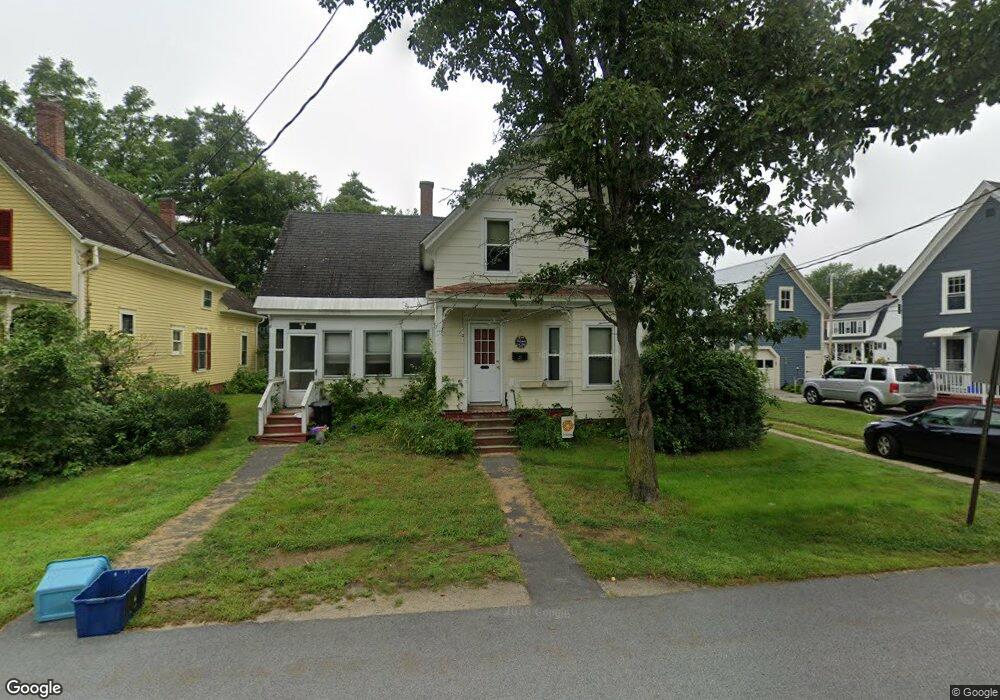
4 Donovan St Concord, NH 03301
South End NeighborhoodEstimated Value: $339,000 - $374,000
3
Beds
1
Bath
1,077
Sq Ft
$332/Sq Ft
Est. Value
About This Home
This home is located at 4 Donovan St, Concord, NH 03301 and is currently estimated at $357,334, approximately $331 per square foot. 4 Donovan St is a home located in Merrimack County with nearby schools including Abbot-Downing School, Rundlett Middle School, and Concord High School.
Ownership History
Date
Name
Owned For
Owner Type
Purchase Details
Closed on
Feb 1, 2024
Sold by
Humphreys Paul S and Humphreys Jo A
Bought by
Young Shane A and Young Ronda J
Current Estimated Value
Home Financials for this Owner
Home Financials are based on the most recent Mortgage that was taken out on this home.
Original Mortgage
$250,000
Outstanding Balance
$244,592
Interest Rate
6.61%
Mortgage Type
Purchase Money Mortgage
Estimated Equity
$112,742
Create a Home Valuation Report for This Property
The Home Valuation Report is an in-depth analysis detailing your home's value as well as a comparison with similar homes in the area
Home Values in the Area
Average Home Value in this Area
Purchase History
| Date | Buyer | Sale Price | Title Company |
|---|---|---|---|
| Young Shane A | $275,000 | None Available |
Source: Public Records
Mortgage History
| Date | Status | Borrower | Loan Amount |
|---|---|---|---|
| Open | Young Shane A | $250,000 |
Source: Public Records
Tax History
| Year | Tax Paid | Tax Assessment Tax Assessment Total Assessment is a certain percentage of the fair market value that is determined by local assessors to be the total taxable value of land and additions on the property. | Land | Improvement |
|---|---|---|---|---|
| 2025 | $5,315 | $182,600 | $103,000 | $79,600 |
| 2024 | $5,056 | $182,600 | $103,000 | $79,600 |
| 2023 | $4,899 | $182,400 | $103,000 | $79,400 |
| 2022 | $4,722 | $182,400 | $103,000 | $79,400 |
| 2021 | $4,913 | $195,600 | $103,000 | $92,600 |
| 2020 | $4,621 | $172,700 | $86,100 | $86,600 |
| 2019 | $4,364 | $157,100 | $84,700 | $72,400 |
| 2018 | $4,214 | $149,500 | $81,300 | $68,200 |
| 2017 | $4,064 | $143,900 | $79,900 | $64,000 |
| 2016 | $3,868 | $139,800 | $79,900 | $59,900 |
| 2015 | $3,590 | $131,300 | $72,600 | $58,700 |
| 2014 | $3,520 | $131,300 | $72,600 | $58,700 |
| 2013 | $3,343 | $130,700 | $72,600 | $58,100 |
| 2012 | $3,305 | $135,600 | $72,600 | $63,000 |
Source: Public Records
Map
Nearby Homes
- 33 Joffre St
- 40 Nivelle St
- 335 S Main St
- 289 South St
- 0 South St Unit 4969509
- 273-279 S Main St
- 30 Longmeadow Dr
- 47 Noyes St
- 47 South St
- 111 -113 South Main St
- 58 S State St
- 7-9 Myrtle St
- 5 Holly Cir
- 5 Windchime Dr
- 21 Fairfield Dr
- 22 Fairfield Dr
- 20 Fairfield Dr
- 25 N Spring St
- 26 Jonathan Ln
- 4 Bow Center Rd Unit F2
Your Personal Tour Guide
Ask me questions while you tour the home.