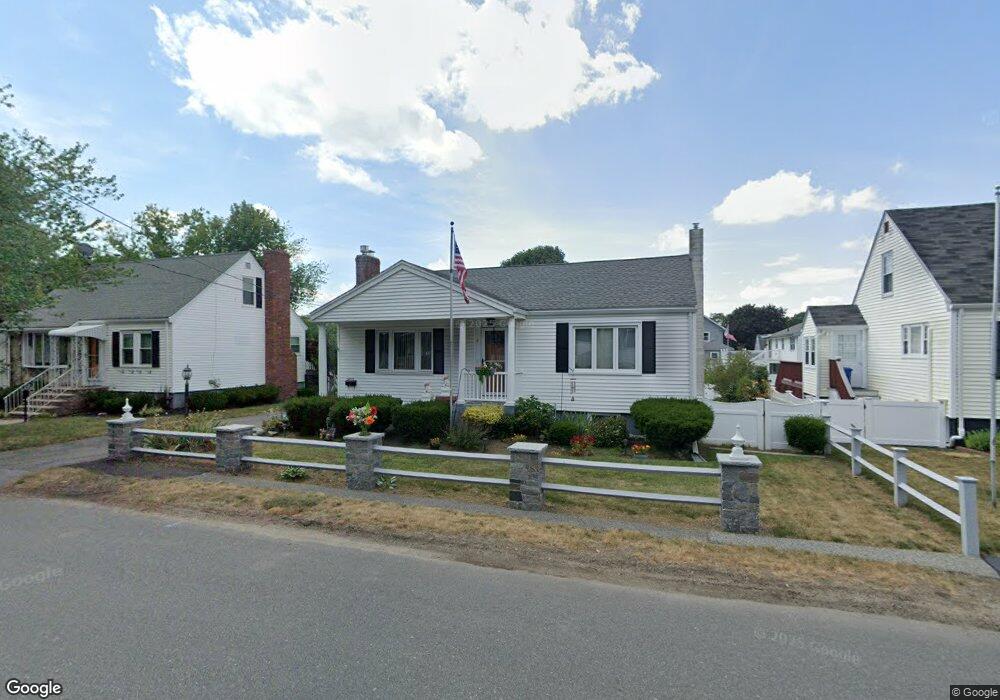
4 Elmwood Ave Saugus, MA 01906
Pleasant Hills NeighborhoodEstimated Value: $618,529 - $684,000
2
Beds
2
Baths
1,115
Sq Ft
$590/Sq Ft
Est. Value
About This Home
This home is located at 4 Elmwood Ave, Saugus, MA 01906 and is currently estimated at $657,632, approximately $589 per square foot. 4 Elmwood Ave is a home located in Essex County with nearby schools including Saugus High School, Pioneer Charter School Of Science II, and Melrose Montessori School.
Ownership History
Date
Name
Owned For
Owner Type
Purchase Details
Closed on
Feb 1, 2017
Sold by
Citroni Annie C
Bought by
Annie C Citroni Irt
Current Estimated Value
Purchase Details
Closed on
May 31, 2002
Sold by
Sicarello John P and Sicarello Theresa
Bought by
Citroni Annie C
Home Financials for this Owner
Home Financials are based on the most recent Mortgage that was taken out on this home.
Original Mortgage
$156,900
Interest Rate
7%
Mortgage Type
Purchase Money Mortgage
Create a Home Valuation Report for This Property
The Home Valuation Report is an in-depth analysis detailing your home's value as well as a comparison with similar homes in the area
Home Values in the Area
Average Home Value in this Area
Purchase History
| Date | Buyer | Sale Price | Title Company |
|---|---|---|---|
| Annie C Citroni Irt | -- | -- | |
| Citroni Annie C | $286,900 | -- |
Source: Public Records
Mortgage History
| Date | Status | Borrower | Loan Amount |
|---|---|---|---|
| Previous Owner | Citroni Annie C | $156,900 | |
| Previous Owner | Citroni Annie C | $40,000 |
Source: Public Records
Tax History Compared to Growth
Tax History
| Year | Tax Paid | Tax Assessment Tax Assessment Total Assessment is a certain percentage of the fair market value that is determined by local assessors to be the total taxable value of land and additions on the property. | Land | Improvement |
|---|---|---|---|---|
| 2025 | $6,267 | $586,800 | $320,000 | $266,800 |
| 2024 | $6,094 | $572,200 | $311,300 | $260,900 |
| 2023 | $5,810 | $516,000 | $272,400 | $243,600 |
| 2022 | $5,557 | $462,700 | $253,400 | $209,300 |
| 2021 | $5,175 | $419,400 | $210,100 | $209,300 |
| 2020 | $4,783 | $401,300 | $199,800 | $201,500 |
| 2019 | $4,684 | $384,600 | $190,200 | $194,400 |
| 2018 | $4,272 | $368,900 | $181,600 | $187,300 |
| 2017 | $3,919 | $325,200 | $173,000 | $152,200 |
| 2016 | $3,876 | $317,700 | $164,300 | $153,400 |
| 2015 | $3,637 | $302,600 | $156,500 | $146,100 |
| 2014 | $3,389 | $291,900 | $156,500 | $135,400 |
Source: Public Records
Map
Nearby Homes