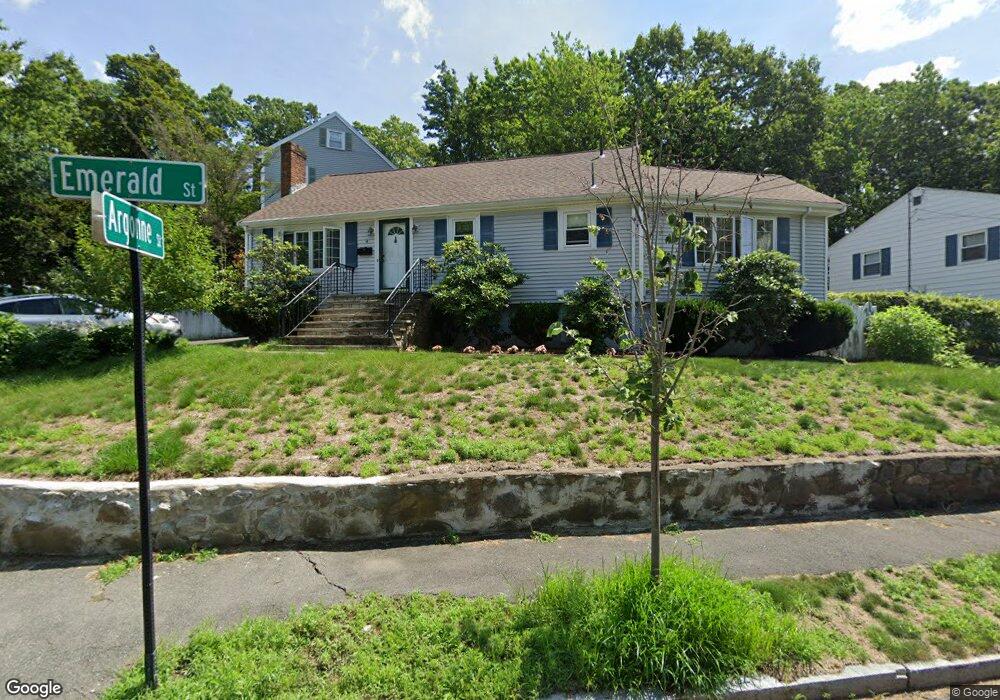
4 Emerald St Quincy, MA 02169
Estimated Value: $675,802 - $788,000
3
Beds
2
Baths
1,080
Sq Ft
$690/Sq Ft
Est. Value
About This Home
This home is located at 4 Emerald St, Quincy, MA 02169 and is currently estimated at $745,201, approximately $690 per square foot. 4 Emerald St is a home located in Norfolk County with nearby schools including Montclair Elementary School, Atlantic Middle School, and North Quincy High School.
Ownership History
Date
Name
Owned For
Owner Type
Purchase Details
Closed on
Jun 30, 2019
Sold by
Ho Ming K and Ho Jessica M
Bought by
Ho Celinna and Ho Christina
Current Estimated Value
Purchase Details
Closed on
Mar 1, 2002
Sold by
Montminy Thomas A and Montminy Amy W
Bought by
Ho Ming K and Ho Jessica M
Home Financials for this Owner
Home Financials are based on the most recent Mortgage that was taken out on this home.
Original Mortgage
$150,000
Interest Rate
6.85%
Mortgage Type
Purchase Money Mortgage
Purchase Details
Closed on
Jun 14, 1990
Sold by
Montminy Alphonse A
Bought by
Montminy Thomas A
Home Financials for this Owner
Home Financials are based on the most recent Mortgage that was taken out on this home.
Original Mortgage
$155,000
Interest Rate
10.54%
Mortgage Type
Purchase Money Mortgage
Create a Home Valuation Report for This Property
The Home Valuation Report is an in-depth analysis detailing your home's value as well as a comparison with similar homes in the area
Purchase History
| Date | Buyer | Sale Price | Title Company |
|---|---|---|---|
| Ho Celinna | -- | -- | |
| Ho Ming K | $325,000 | -- | |
| Montminy Thomas A | $155,000 | -- |
Source: Public Records
Mortgage History
| Date | Status | Borrower | Loan Amount |
|---|---|---|---|
| Previous Owner | Montminy Thomas A | $87,300 | |
| Previous Owner | Ho Ming K | $150,000 | |
| Previous Owner | Montminy Thomas A | $70,000 | |
| Previous Owner | Montminy Thomas A | $155,000 |
Source: Public Records
Tax History
| Year | Tax Paid | Tax Assessment Tax Assessment Total Assessment is a certain percentage of the fair market value that is determined by local assessors to be the total taxable value of land and additions on the property. | Land | Improvement |
|---|---|---|---|---|
| 2025 | $6,742 | $584,700 | $293,000 | $291,700 |
| 2024 | $6,262 | $555,600 | $279,100 | $276,500 |
| 2023 | $5,970 | $536,400 | $265,800 | $270,600 |
| 2022 | $5,405 | $451,200 | $212,700 | $238,500 |
| 2021 | $5,145 | $423,800 | $212,700 | $211,100 |
| 2020 | $5,165 | $415,500 | $212,700 | $202,800 |
| 2019 | $5,010 | $399,200 | $206,500 | $192,700 |
| 2018 | $4,873 | $365,300 | $191,200 | $174,100 |
| 2017 | $4,781 | $337,400 | $182,000 | $155,400 |
| 2016 | $4,430 | $308,500 | $165,500 | $143,000 |
| 2015 | $4,358 | $298,500 | $156,200 | $142,300 |
| 2014 | $4,367 | $293,900 | $156,200 | $137,700 |
Source: Public Records
Map
Nearby Homes
- 84 Gardiner Rd
- 114 Willard St Unit 4
- 46 Century Ln
- 230 Willard St Unit 102
- 440 Granite Ave Unit 201
- 41 Wallace Rd
- 1185 Brook Rd
- 40 Dean Rd
- 397 Adams St
- 400 Adams St Unit A
- 0 Franklin St
- 207 Pleasant St
- 39 Cross St
- 459 Willard St Unit 303
- 40 Cross St Unit 1
- 510 Willard St
- 52 California Ave
- 211 Copeland St
- 111-113 Pleasant St
- 97 Pleasant St
Your Personal Tour Guide
Ask me questions while you tour the home.