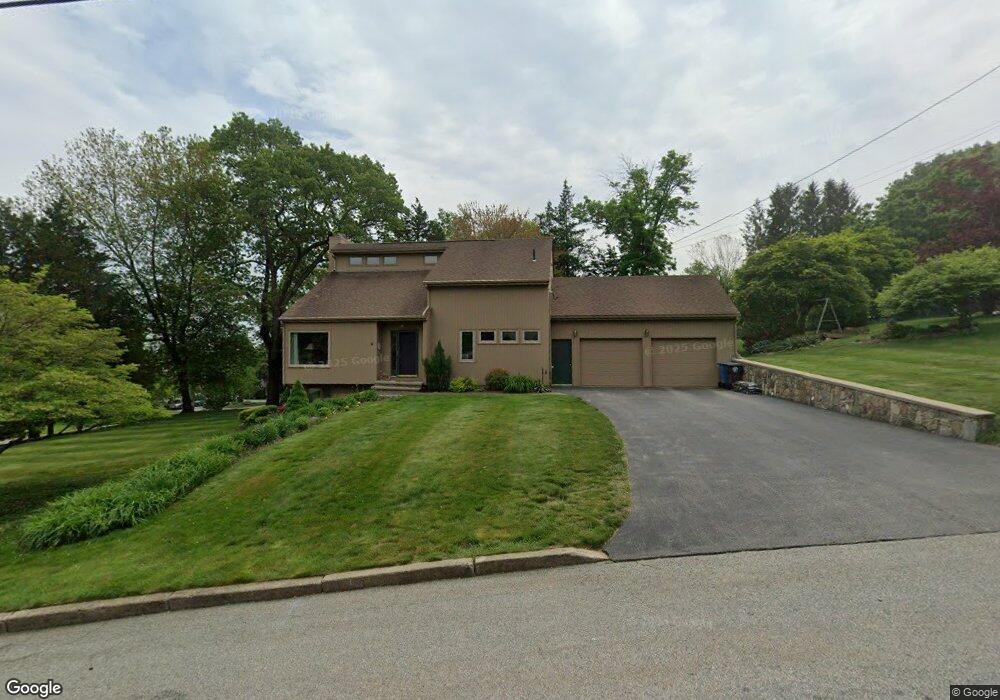
4 Eric Ct Cranston, RI 02921
Western Cranston NeighborhoodEstimated Value: $618,000 - $725,000
3
Beds
3
Baths
2,262
Sq Ft
$289/Sq Ft
Est. Value
About This Home
This home is located at 4 Eric Ct, Cranston, RI 02921 and is currently estimated at $654,267, approximately $289 per square foot. 4 Eric Ct is a home located in Providence County with nearby schools including Orchard Farms El. School, Hope Highlands Middle School, and Cranston High School West.
Ownership History
Date
Name
Owned For
Owner Type
Purchase Details
Closed on
Jul 12, 1996
Sold by
Southern Newengland Co
Bought by
Wendoloski Dorothy E
Current Estimated Value
Home Financials for this Owner
Home Financials are based on the most recent Mortgage that was taken out on this home.
Original Mortgage
$82,500
Interest Rate
7.98%
Create a Home Valuation Report for This Property
The Home Valuation Report is an in-depth analysis detailing your home's value as well as a comparison with similar homes in the area
Home Values in the Area
Average Home Value in this Area
Purchase History
| Date | Buyer | Sale Price | Title Company |
|---|---|---|---|
| Wendoloski Dorothy E | $158,000 | -- |
Source: Public Records
Mortgage History
| Date | Status | Borrower | Loan Amount |
|---|---|---|---|
| Open | Wendoloski Dorothy E | $915,689 | |
| Closed | Wendoloski Dorothy E | $101,400 | |
| Closed | Wendoloski Dorothy E | $82,500 |
Source: Public Records
Tax History
| Year | Tax Paid | Tax Assessment Tax Assessment Total Assessment is a certain percentage of the fair market value that is determined by local assessors to be the total taxable value of land and additions on the property. | Land | Improvement |
|---|---|---|---|---|
| 2025 | $6,828 | $491,900 | $160,200 | $331,700 |
| 2024 | $6,695 | $491,900 | $160,200 | $331,700 |
| 2023 | $6,541 | $346,100 | $114,500 | $231,600 |
| 2022 | $6,406 | $346,100 | $114,500 | $231,600 |
| 2021 | $6,230 | $346,100 | $114,500 | $231,600 |
| 2020 | $6,937 | $334,000 | $118,600 | $215,400 |
| 2019 | $6,937 | $334,000 | $118,600 | $215,400 |
| 2018 | $6,777 | $334,000 | $118,600 | $215,400 |
| 2017 | $6,790 | $296,000 | $106,300 | $189,700 |
| 2016 | $6,645 | $296,000 | $106,300 | $189,700 |
| 2015 | $6,645 | $296,000 | $106,300 | $189,700 |
| 2014 | $6,315 | $300,000 | $102,200 | $197,800 |
Source: Public Records
Map
Nearby Homes
- 1213 Phenix Ave
- 311 Hope Rd
- 0 Anthony Dr Unit 1394338
- 1100 Phenix Ave
- 102 Moccasin Trail
- 59 Camden Ln
- 64 Cardinal Rd
- 74 Cardinal Rd
- 8 Ashton Ct
- 1495 Pippin Orchard Rd
- 46 Hornbeam Dr
- 22 Derby Ln
- 1715 Phenix Ave
- 141 Fox Ridge Dr
- 178 Highland St
- 78 Wilbur Ave
- 27 Shean St
- 105 Amy Dr
- 7 Squantum St
- 29 Valley St
Your Personal Tour Guide
Ask me questions while you tour the home.