
Landlord's Agent in 2021
Lise Tremblay
BHHS Verani Nashua
(603) 377-0771
2 in this area
41 Total Sales
Estimated Value: $411,894 - $487,000
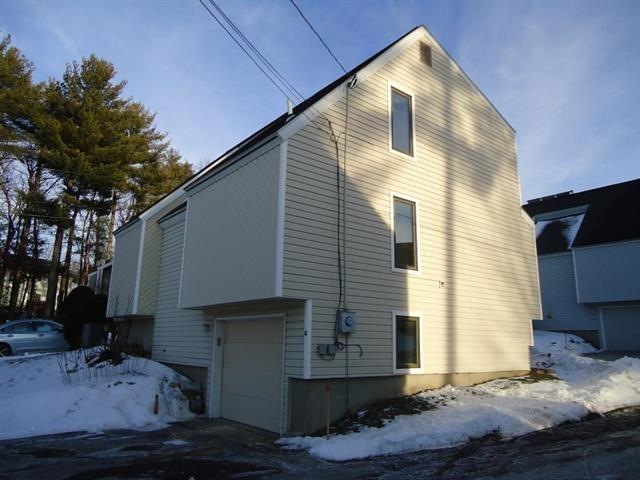
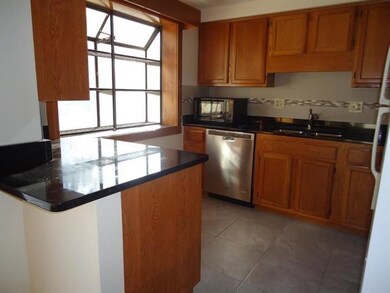
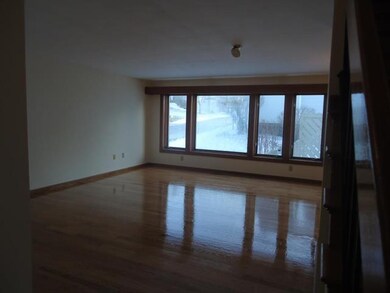
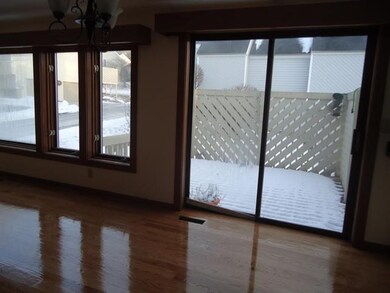
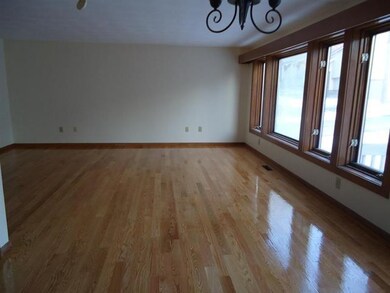
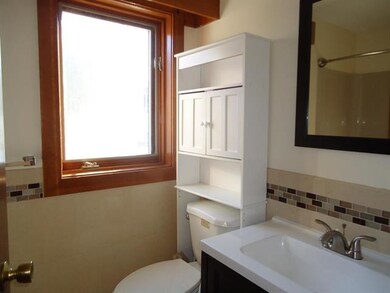
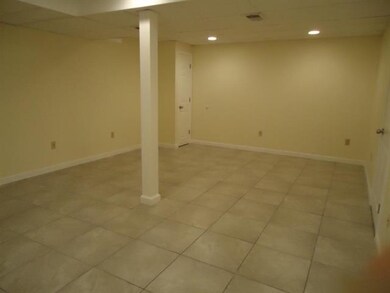
Very nice detached passive solar contemporary home. renovated in 2016. Hardwood floors, tile kitchen + bath. Granite counter tops. 3 bedrooms on the second floor. 1 on first level or office. First floor laundry hookup. Central Air. Kensington Ridge condo takes care of snow clean up of driveway + walkways to front door and landscaping. Finished family room in the lower level. Half a mile from exit 5W Rte. 3. No pets. Good credit. References. No smoking, Long term preferred. Showing start Saturday Jan 30th
Last Agent to Rent the Property
BHHS Verani Nashua License #057983 Listed on: 01/28/2021
| Date | Buyer | Sale Price | Title Company |
|---|---|---|---|
| Jia James | $355,000 | None Available | |
| Jia James | $355,000 | None Available | |
| Wang Rose L | $237,000 | -- | |
| Wang Rose L | $237,000 | -- | |
| Cheng Mike M | $143,300 | -- | |
| Cheng Mike M | $143,300 | -- |
| Date | Status | Borrower | Loan Amount |
|---|---|---|---|
| Open | Jia James | $284,000 | |
| Closed | Jia James | $284,000 | |
| Previous Owner | Cheng Mike M | $113,750 | |
| Previous Owner | Cheng Mike M | $180,000 | |
| Previous Owner | Cheng Mike M | $114,600 |
| Date | Event | Price | List to Sale | Price per Sq Ft |
|---|---|---|---|---|
| 02/19/2021 02/19/21 | Rented | $2,550 | 0.0% | -- |
| 02/15/2021 02/15/21 | Under Contract | -- | -- | -- |
| 01/28/2021 01/28/21 | For Rent | $2,550 | -99.9% | -- |
| 09/19/2019 09/19/19 | Rented | $2,250,000 | +99900.0% | -- |
| 08/26/2019 08/26/19 | For Rent | $2,250 | +4.7% | -- |
| 03/16/2018 03/16/18 | Rented | $2,150 | 0.0% | -- |
| 03/02/2018 03/02/18 | Under Contract | -- | -- | -- |
| 02/19/2018 02/19/18 | For Rent | $2,150 | +7.5% | -- |
| 04/26/2016 04/26/16 | Rented | $2,000 | 0.0% | -- |
| 02/26/2016 02/26/16 | Under Contract | -- | -- | -- |
| 01/20/2016 01/20/16 | For Rent | $2,000 | -- | -- |
| Year | Tax Paid | Tax Assessment Tax Assessment Total Assessment is a certain percentage of the fair market value that is determined by local assessors to be the total taxable value of land and additions on the property. | Land | Improvement |
|---|---|---|---|---|
| 2024 | $6,273 | $394,500 | $0 | $394,500 |
| 2023 | $5,759 | $315,900 | $0 | $315,900 |
| 2022 | $5,708 | $315,900 | $0 | $315,900 |
| 2021 | $4,939 | $212,700 | $0 | $212,700 |
| 2020 | $4,789 | $211,800 | $0 | $211,800 |
| 2019 | $4,609 | $211,800 | $0 | $211,800 |
| 2018 | $4,492 | $211,800 | $0 | $211,800 |
| 2017 | $3,827 | $148,400 | $0 | $148,400 |
| 2016 | $3,720 | $148,400 | $0 | $148,400 |
| 2015 | $3,640 | $148,400 | $0 | $148,400 |
| 2014 | $3,605 | $149,900 | $0 | $149,900 |
Landlord's Agent in 2021
Lise Tremblay
BHHS Verani Nashua
(603) 377-0771
2 in this area
41 Total Sales
S
Seller's Agent in 2019
Shirley Ong
RE/MAX
Buyer's Agent in 2019
John Martein
RE/MAX
(603) 305-8422
4 in this area
37 Total Sales
B
Buyer's Agent in 2018
Bill Spinelli
Bean Group / Nashua
Source: PrimeMLS
MLS Number: 4845476
APN: NASH-000000-000202-000059E
Disclaimer: Certain information contained herein is derived from information provided by parties other than Homes.com. All information provided is deemed reliable, but is not guaranteed to be accurate and should be independently verified.
![]() Copyright 2025 PrimeMLS, Inc. All rights reserved. This information is deemed reliable, but not guaranteed. The data relating to real estate displayed on this display comes in part from the IDX Program of PrimeMLS. The information being provided is for consumers’ personal, non-commercial use and may not be used for any purpose other than to identify prospective properties consumers may be interested in purchasing.
Copyright 2025 PrimeMLS, Inc. All rights reserved. This information is deemed reliable, but not guaranteed. The data relating to real estate displayed on this display comes in part from the IDX Program of PrimeMLS. The information being provided is for consumers’ personal, non-commercial use and may not be used for any purpose other than to identify prospective properties consumers may be interested in purchasing.