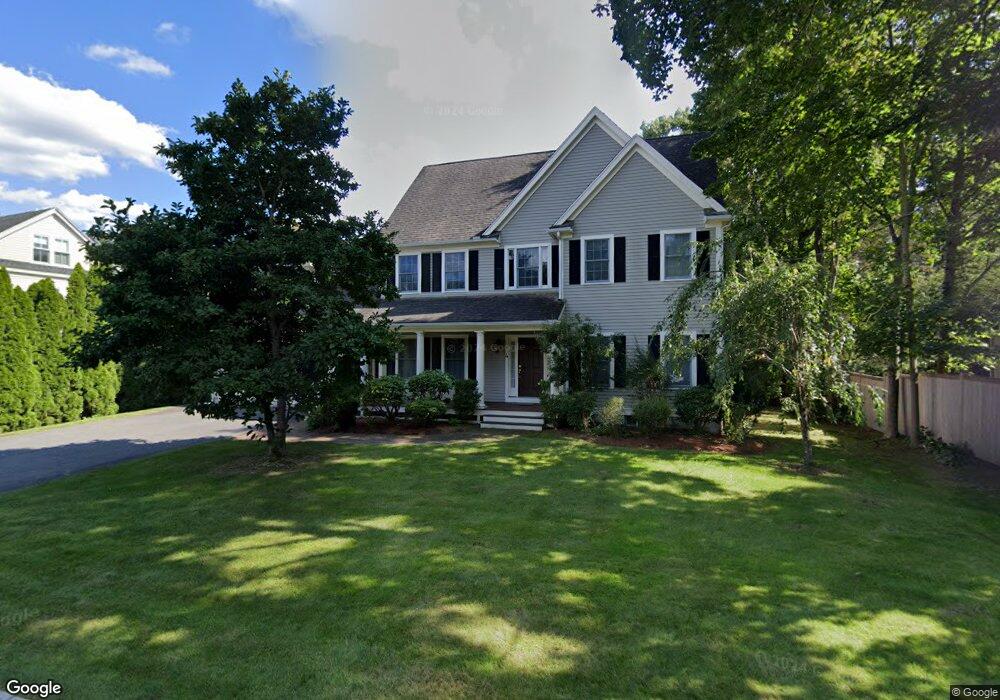
4 Front St Natick, MA 01760
Estimated Value: $1,430,835 - $1,694,000
4
Beds
3
Baths
2,830
Sq Ft
$544/Sq Ft
Est. Value
About This Home
This home is located at 4 Front St, Natick, MA 01760 and is currently estimated at $1,538,959, approximately $543 per square foot. 4 Front St is a home located in Middlesex County with nearby schools including Natick High School, Memorial Elementary School, and J F Kennedy Middle School.
Ownership History
Date
Name
Owned For
Owner Type
Purchase Details
Closed on
Jun 5, 2002
Sold by
Mac Bldrs and Macdonald
Bought by
Siegel Steven B and Zalkind-Siegel Dana
Current Estimated Value
Home Financials for this Owner
Home Financials are based on the most recent Mortgage that was taken out on this home.
Original Mortgage
$350,000
Outstanding Balance
$148,929
Interest Rate
6.9%
Mortgage Type
Purchase Money Mortgage
Estimated Equity
$1,390,030
Purchase Details
Closed on
Jul 25, 2001
Sold by
Roma Rt and Beirne
Bought by
Macdonald James M and Macdonald Kenneth R
Home Financials for this Owner
Home Financials are based on the most recent Mortgage that was taken out on this home.
Original Mortgage
$407,000
Interest Rate
7.18%
Mortgage Type
Purchase Money Mortgage
Purchase Details
Closed on
Apr 11, 1997
Sold by
Beirne Robert and Gomes Patricia
Bought by
Roma Rt and Beirne
Create a Home Valuation Report for This Property
The Home Valuation Report is an in-depth analysis detailing your home's value as well as a comparison with similar homes in the area
Home Values in the Area
Average Home Value in this Area
Purchase History
| Date | Buyer | Sale Price | Title Company |
|---|---|---|---|
| Siegel Steven B | $702,000 | -- | |
| Macdonald James M | $210,000 | -- | |
| Roma Rt | $12,000 | -- |
Source: Public Records
Mortgage History
| Date | Status | Borrower | Loan Amount |
|---|---|---|---|
| Open | Siegel Steven B | $350,000 | |
| Previous Owner | Roma Rt | $407,000 |
Source: Public Records
Tax History
| Year | Tax Paid | Tax Assessment Tax Assessment Total Assessment is a certain percentage of the fair market value that is determined by local assessors to be the total taxable value of land and additions on the property. | Land | Improvement |
|---|---|---|---|---|
| 2025 | $14,397 | $1,203,800 | $460,300 | $743,500 |
| 2024 | $13,913 | $1,134,800 | $434,700 | $700,100 |
| 2023 | $12,946 | $1,024,200 | $408,200 | $616,000 |
| 2022 | $12,700 | $952,000 | $371,700 | $580,300 |
| 2021 | $12,148 | $892,600 | $351,300 | $541,300 |
| 2020 | $11,940 | $877,300 | $336,000 | $541,300 |
| 2019 | $11,150 | $877,300 | $336,000 | $541,300 |
| 2018 | $11,300 | $865,900 | $320,800 | $545,100 |
| 2017 | $11,062 | $820,000 | $284,800 | $535,200 |
| 2016 | $10,914 | $804,300 | $274,400 | $529,900 |
| 2015 | $10,500 | $759,800 | $274,400 | $485,400 |
Source: Public Records
Map
Nearby Homes
Your Personal Tour Guide
Ask me questions while you tour the home.