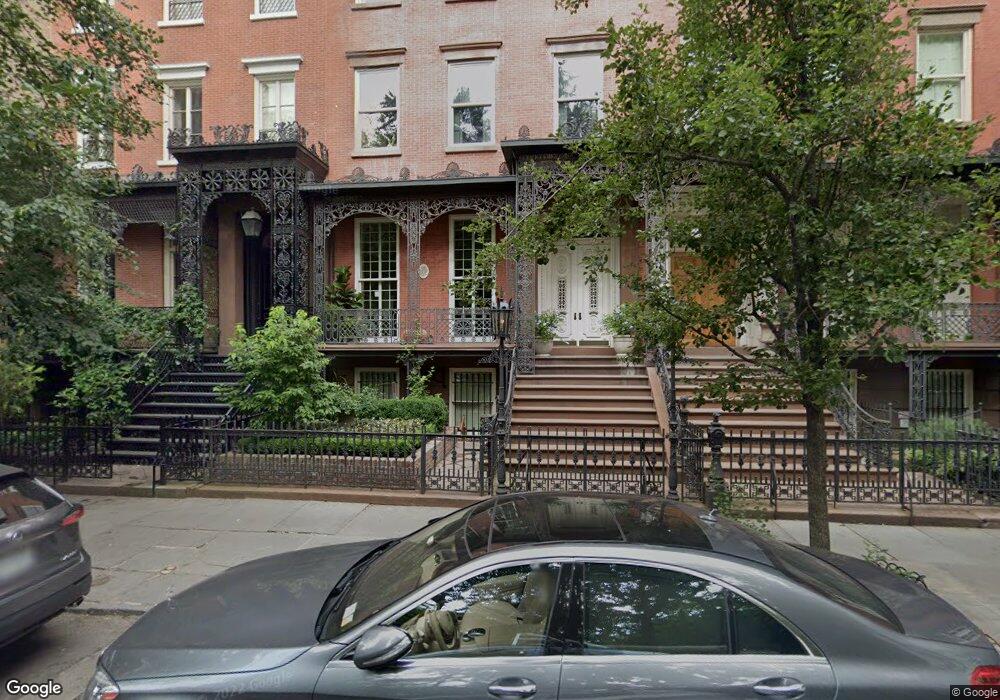
4 Gramercy Park W New York, NY 10003
Gramercy Park NeighborhoodEstimated Value: $2,560,000 - $22,952,240
--
Bed
--
Bath
8,759
Sq Ft
$1,456/Sq Ft
Est. Value
About This Home
This home is located at 4 Gramercy Park W, New York, NY 10003 and is currently estimated at $12,756,120, approximately $1,456 per square foot. 4 Gramercy Park W is a home located in New York County with nearby schools including P.S. 40 Augustus Saint-Gaudens, Simon Baruch Middle School 104, and Clinton School.
Ownership History
Date
Name
Owned For
Owner Type
Purchase Details
Closed on
May 18, 2017
Sold by
Chelsea Land Company Llc and Chelsea Land Company Llc
Bought by
4 Desolation Row Llc
Current Estimated Value
Home Financials for this Owner
Home Financials are based on the most recent Mortgage that was taken out on this home.
Original Mortgage
$15,000,000
Outstanding Balance
$12,429,618
Interest Rate
3.97%
Mortgage Type
Commercial
Estimated Equity
$326,502
Purchase Details
Closed on
Jul 24, 2000
Sold by
Zagoreos Alexander E and Zagoreos Marine
Bought by
Chelsea Land Company Llc
Purchase Details
Closed on
Jun 19, 1995
Sold by
Jossel Marguerite and Appelman Marguerite
Bought by
Zagoreos Alexander E and Zagoreos Marine
Create a Home Valuation Report for This Property
The Home Valuation Report is an in-depth analysis detailing your home's value as well as a comparison with similar homes in the area
Home Values in the Area
Average Home Value in this Area
Purchase History
| Date | Buyer | Sale Price | Title Company |
|---|---|---|---|
| 4 Desolation Row Llc | $23,094,094 | -- | |
| 4 Desolation Row Llc | $23,094,094 | -- | |
| Chelsea Land Company Llc | $6,401,000 | First American | |
| Chelsea Land Company Llc | $6,401,000 | First American | |
| Zagoreos Alexander E | $1,800,000 | The Title Guarantee Company | |
| Zagoreos Alexander E | $1,800,000 | The Title Guarantee Company |
Source: Public Records
Mortgage History
| Date | Status | Borrower | Loan Amount |
|---|---|---|---|
| Open | 4 Desolation Row Llc | $15,000,000 | |
| Closed | 4 Desolation Row Llc | $15,000,000 |
Source: Public Records
Tax History Compared to Growth
Tax History
| Year | Tax Paid | Tax Assessment Tax Assessment Total Assessment is a certain percentage of the fair market value that is determined by local assessors to be the total taxable value of land and additions on the property. | Land | Improvement |
|---|---|---|---|---|
| 2025 | $146,319 | $746,328 | $252,707 | $493,621 |
| 2024 | $146,319 | $728,498 | $363,840 | $427,325 |
| 2023 | $139,576 | $687,262 | $315,652 | $371,610 |
| 2022 | $124,159 | $648,360 | $363,840 | $284,520 |
| 2021 | $103,087 | $489,840 | $363,840 | $126,000 |
| 2020 | $105,438 | $2,799,000 | $535,500 | $2,263,500 |
| 2019 | $97,878 | $2,600,100 | $535,500 | $2,064,600 |
| 2018 | $99,553 | $782,713 | $193,443 | $589,270 |
| 2017 | $92,197 | $724,877 | $202,632 | $522,245 |
| 2016 | $90,537 | $702,271 | $210,504 | $491,767 |
| 2015 | $37,451 | $650,253 | $204,926 | $445,327 |
| 2014 | $37,451 | $602,087 | $161,625 | $440,462 |
Source: Public Records
Map
Nearby Homes
- 105 E 19th St Unit 1C
- 113 E 19th St
- 11 Gramercy Park S Unit TH
- 240 Park Ave S Unit 14 BE
- 13 Gramercy Park S Unit 4-FLR
- 13 Gramercy Park S Unit 4
- 222 Park Ave S Unit 8E
- 81 Irving Place Unit 15DE
- 81 Irving Place Unit 10D
- 81 Irving Place Unit 3F
- 7 Gramercy Park W Unit 2C
- 254 Park Ave S Unit 7PR
- 254 Park Ave S Unit 6PR
- 254 Park Ave S Unit 6G
- 254 Park Ave S Unit 11NO
- 254 Park Ave S Unit 3L
- 254 Park Ave S Unit 9G
- 254 Park Ave S Unit 9D
- 254 Park Ave S Unit 7 P
- 254 Park Ave S Unit GARDEN
- 4 Gramercy Park W Unit 2
- 4 Gramercy Park W Unit 1
- 3 Gramercy Park W Unit PH
- 3 Gramercy Park W
- 3 Gramercy Park W Unit 2 FL
- 3 Gramercy Park W Unit PARLOR
- 2 Gramercy Park W Unit 3 F
- 2 Gramercy Park W
- 2 Gramercy Park W Unit 1FL
- 2 Gramercy Park W Unit 2 FL
- 7 Gramercy Park W
- 7 Gramercy Park W Unit 7D
- 7 Gramercy Park W Unit 7B
- 7 Gramercy Park W Unit 7A
- 7 Gramercy Park W Unit 6C
- 7 Gramercy Park W Unit 6B
- 7 Gramercy Park W Unit 6A
- 7 Gramercy Park W Unit 5C
- 7 Gramercy Park W Unit 5B
- 7 Gramercy Park W Unit 5A