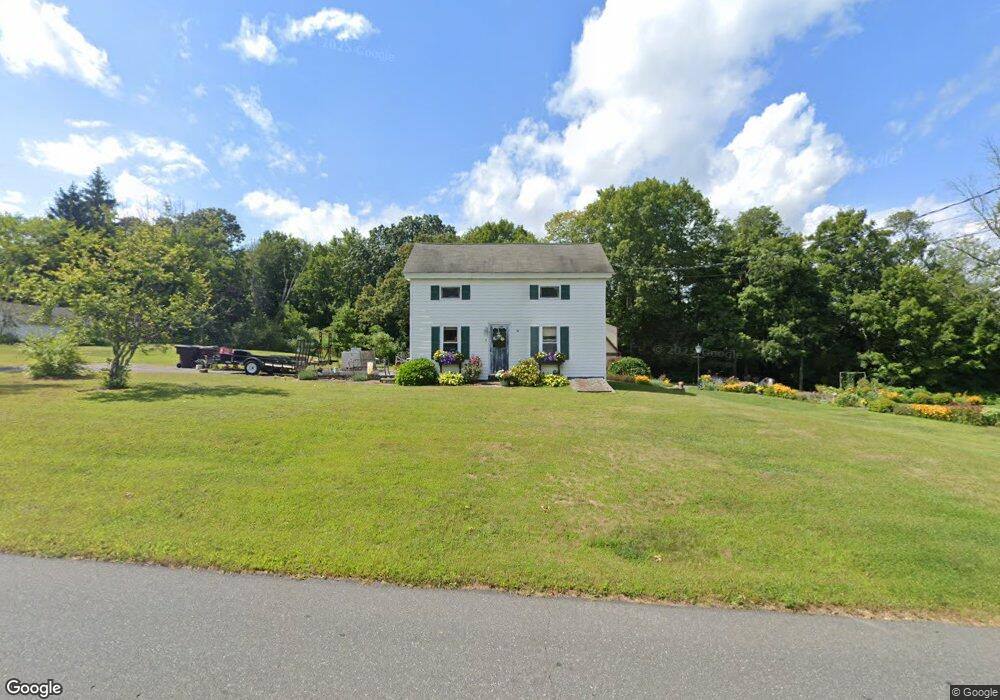
4 Grant Rd Enfield, CT 06082
Estimated Value: $254,396 - $281,000
2
Beds
1
Bath
959
Sq Ft
$281/Sq Ft
Est. Value
About This Home
This home is located at 4 Grant Rd, Enfield, CT 06082 and is currently estimated at $269,099, approximately $280 per square foot. 4 Grant Rd is a home located in Hartford County with nearby schools including Edgar H. Parkman School, Nathan Hale Elementary School, and Enfield High School.
Ownership History
Date
Name
Owned For
Owner Type
Purchase Details
Closed on
Dec 26, 2001
Sold by
Kamay Frank and Kamay Sandra
Bought by
Scavetta James and Scavetta Faith
Current Estimated Value
Home Financials for this Owner
Home Financials are based on the most recent Mortgage that was taken out on this home.
Original Mortgage
$72,000
Outstanding Balance
$31,452
Interest Rate
6.61%
Estimated Equity
$237,647
Purchase Details
Closed on
Dec 22, 1997
Sold by
Kamay Frank and Kamay Josephine
Bought by
Kamay Frank and Kamay Sandra
Home Financials for this Owner
Home Financials are based on the most recent Mortgage that was taken out on this home.
Original Mortgage
$31,000
Interest Rate
6%
Purchase Details
Closed on
Oct 20, 1989
Sold by
Zaugg Barry
Bought by
Martin Robert
Home Financials for this Owner
Home Financials are based on the most recent Mortgage that was taken out on this home.
Original Mortgage
$107,800
Interest Rate
10.06%
Create a Home Valuation Report for This Property
The Home Valuation Report is an in-depth analysis detailing your home's value as well as a comparison with similar homes in the area
Home Values in the Area
Average Home Value in this Area
Purchase History
| Date | Buyer | Sale Price | Title Company |
|---|---|---|---|
| Scavetta James | $95,900 | -- | |
| Kamay Frank | $71,000 | -- | |
| Martin Robert | $121,000 | -- |
Source: Public Records
Mortgage History
| Date | Status | Borrower | Loan Amount |
|---|---|---|---|
| Open | Martin Robert | $72,000 | |
| Previous Owner | Martin Robert | $31,000 | |
| Previous Owner | Martin Robert | $107,800 |
Source: Public Records
Tax History
| Year | Tax Paid | Tax Assessment Tax Assessment Total Assessment is a certain percentage of the fair market value that is determined by local assessors to be the total taxable value of land and additions on the property. | Land | Improvement |
|---|---|---|---|---|
| 2025 | $4,451 | $127,200 | $66,900 | $60,300 |
| 2024 | $4,331 | $127,200 | $66,900 | $60,300 |
| 2023 | $4,299 | $127,200 | $66,900 | $60,300 |
| 2022 | $3,904 | $127,200 | $66,900 | $60,300 |
| 2021 | $3,791 | $101,000 | $57,570 | $43,430 |
| 2020 | $3,791 | $101,000 | $57,570 | $43,430 |
| 2019 | $3,801 | $101,000 | $57,570 | $43,430 |
| 2018 | $3,737 | $101,000 | $57,570 | $43,430 |
| 2017 | $3,528 | $101,000 | $57,570 | $43,430 |
| 2016 | $3,429 | $99,930 | $57,570 | $42,360 |
| 2015 | $3,322 | $99,930 | $57,570 | $42,360 |
| 2014 | $3,236 | $99,930 | $57,570 | $42,360 |
Source: Public Records
Map
Nearby Homes
Your Personal Tour Guide
Ask me questions while you tour the home.