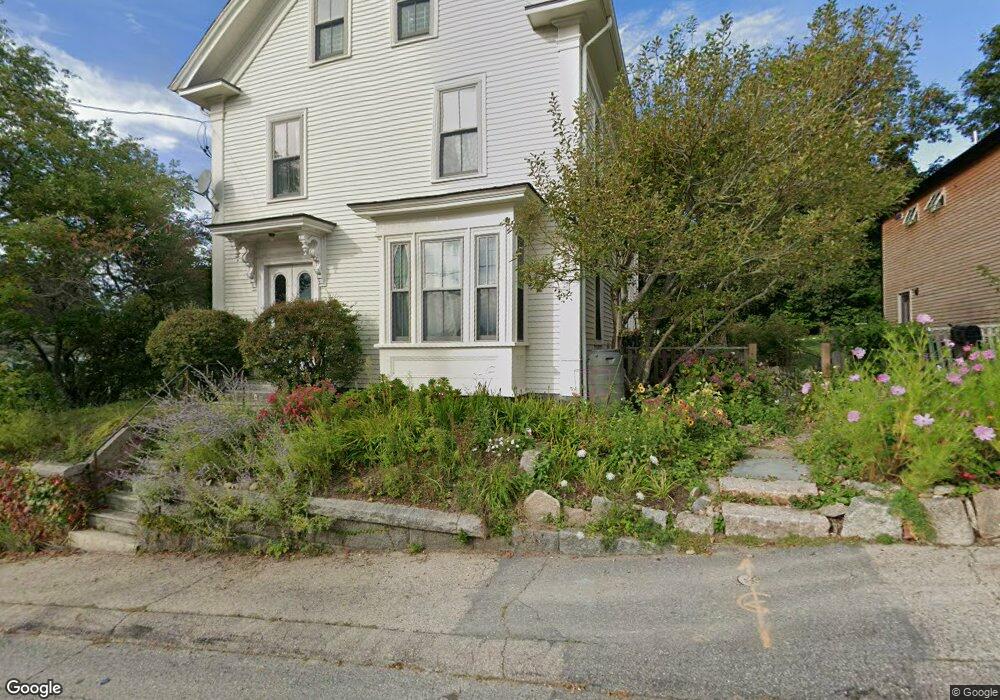
4 Haskell St Gloucester, MA 01930
East Gloucester NeighborhoodEstimated Value: $843,838 - $1,122,000
3
Beds
3
Baths
2,285
Sq Ft
$429/Sq Ft
Est. Value
About This Home
This home is located at 4 Haskell St, Gloucester, MA 01930 and is currently estimated at $980,210, approximately $428 per square foot. 4 Haskell St is a home located in Essex County with nearby schools including East Gloucester Elementary School, Ralph B O'maley Middle School, and Gloucester High School.
Ownership History
Date
Name
Owned For
Owner Type
Purchase Details
Closed on
Dec 7, 2004
Sold by
Salmon Michael R
Bought by
Salmon Michael R
Current Estimated Value
Purchase Details
Closed on
Nov 25, 2003
Sold by
Macisaac Elaine and Schlichte Miles J
Bought by
Hrm Group Nt
Purchase Details
Closed on
Dec 17, 2001
Sold by
Carrigan Carolyn R Est
Bought by
Salmon Michael R
Create a Home Valuation Report for This Property
The Home Valuation Report is an in-depth analysis detailing your home's value as well as a comparison with similar homes in the area
Home Values in the Area
Average Home Value in this Area
Purchase History
| Date | Buyer | Sale Price | Title Company |
|---|---|---|---|
| Salmon Michael R | -- | -- | |
| Hrm Group Nt | $525,000 | -- | |
| Salmon Michael R | $260,000 | -- |
Source: Public Records
Mortgage History
| Date | Status | Borrower | Loan Amount |
|---|---|---|---|
| Open | Salmon Michael R | $259,526 | |
| Closed | Salmon Michael R | $280,000 | |
| Closed | Salmon Michael R | $80,000 |
Source: Public Records
Tax History
| Year | Tax Paid | Tax Assessment Tax Assessment Total Assessment is a certain percentage of the fair market value that is determined by local assessors to be the total taxable value of land and additions on the property. | Land | Improvement |
|---|---|---|---|---|
| 2025 | $6,884 | $708,200 | $249,100 | $459,100 |
| 2024 | $6,728 | $691,500 | $237,200 | $454,300 |
| 2023 | $6,442 | $608,300 | $211,800 | $396,500 |
| 2022 | $6,183 | $527,100 | $180,100 | $347,000 |
| 2021 | $5,964 | $479,400 | $163,700 | $315,700 |
| 2020 | $5,948 | $482,400 | $163,700 | $318,700 |
| 2019 | $5,726 | $451,200 | $163,700 | $287,500 |
| 2018 | $5,562 | $430,200 | $163,700 | $266,500 |
| 2017 | $5,387 | $408,400 | $155,900 | $252,500 |
| 2016 | $5,236 | $384,700 | $156,400 | $228,300 |
| 2015 | $4,900 | $359,000 | $156,400 | $202,600 |
Source: Public Records
Map
Nearby Homes
- 3 Mondello Square
- 5 Wise Place
- 36 Eastern Ave
- 197 E Main St Unit 1
- 139A Prospect St
- 26 Marina Dr
- 60 Rocky Neck Ave Unit 202
- 73 Rocky Neck Ave Unit 2
- 87 Atlantic Rd Unit 2
- 191 Main St Unit 3
- 191 Main St Unit 2A
- 19 Trask St Unit 2
- 50 Warner St
- 113 Pleasant St
- 1 Wonson St
- 40 Sargent St
- 33 Maplewood Ave Unit 310
- 70 Old Nugent Farm Rd
- 10 Seaview Rd
- 35 Middle St Unit 4
- 4 Haskell St Unit ADU
- 6 Haskell St
- 1 Sayward St
- 1 Sayward St Unit 2
- 5 Sayward St
- 3 Haskell St
- 64 E Main St
- 4 Powell Ct
- 7 Sayward St
- 8 Haskell St
- 68 E Main St
- 68 E Main St Unit 68 E. Main Street, G
- 62 E Main St
- 62 E Main St Unit 2
- 5 Powell Ct
- 4 Sayward St
- 60 E Main St
- 9 Sayward St
- 69 E Main St Unit 2
- 7 Haskell St
Your Personal Tour Guide
Ask me questions while you tour the home.