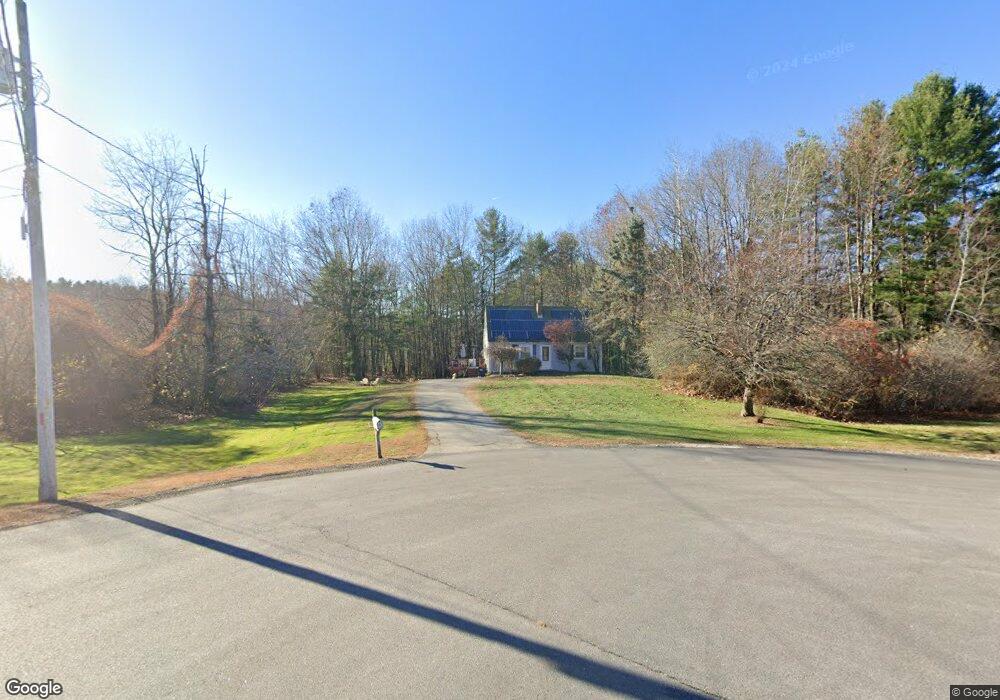
4 Holmgren Ct Stratham, NH 03885
Estimated Value: $544,000 - $674,000
2
Beds
1
Bath
1,170
Sq Ft
$508/Sq Ft
Est. Value
About This Home
This home is located at 4 Holmgren Ct, Stratham, NH 03885 and is currently estimated at $594,675, approximately $508 per square foot. 4 Holmgren Ct is a home located in Rockingham County with nearby schools including Stratham Memorial School, Cooperative Middle School, and Exeter High School.
Ownership History
Date
Name
Owned For
Owner Type
Purchase Details
Closed on
Jun 28, 2021
Sold by
Ciminera Andrew
Bought by
Ciminera Andrew and Ciminera Keri A
Current Estimated Value
Home Financials for this Owner
Home Financials are based on the most recent Mortgage that was taken out on this home.
Original Mortgage
$210,000
Outstanding Balance
$160,497
Interest Rate
2.9%
Mortgage Type
Stand Alone Refi Refinance Of Original Loan
Estimated Equity
$434,178
Purchase Details
Closed on
Jul 21, 2004
Sold by
Fenlon John T and Fenlon Kara E
Bought by
Ciminera Andrew and Ciminera Marjorie
Purchase Details
Closed on
Jan 2, 1996
Sold by
Grocki Deborah A
Bought by
Fenlon John T and Fenlon Kara E
Create a Home Valuation Report for This Property
The Home Valuation Report is an in-depth analysis detailing your home's value as well as a comparison with similar homes in the area
Home Values in the Area
Average Home Value in this Area
Purchase History
| Date | Buyer | Sale Price | Title Company |
|---|---|---|---|
| Ciminera Andrew | -- | None Available | |
| Ciminera Andrew | -- | None Available | |
| Ciminera Andrew | $292,000 | -- | |
| Fenlon John T | $127,500 | -- | |
| Ciminera Andrew | $292,000 | -- | |
| Fenlon John T | $127,500 | -- |
Source: Public Records
Mortgage History
| Date | Status | Borrower | Loan Amount |
|---|---|---|---|
| Open | Ciminera Andrew | $210,000 | |
| Closed | Ciminera Andrew | $210,000 | |
| Previous Owner | Fenlon John T | $326,663 | |
| Previous Owner | Fenlon John T | $327,794 |
Source: Public Records
Tax History Compared to Growth
Tax History
| Year | Tax Paid | Tax Assessment Tax Assessment Total Assessment is a certain percentage of the fair market value that is determined by local assessors to be the total taxable value of land and additions on the property. | Land | Improvement |
|---|---|---|---|---|
| 2024 | $7,076 | $539,300 | $343,400 | $195,900 |
| 2023 | $6,553 | $313,400 | $176,700 | $136,700 |
| 2022 | $5,864 | $313,400 | $176,700 | $136,700 |
| 2021 | $5,804 | $313,400 | $176,700 | $136,700 |
| 2020 | $5,939 | $313,400 | $176,700 | $136,700 |
| 2019 | $5,839 | $313,400 | $176,700 | $136,700 |
| 2018 | $5,594 | $266,400 | $144,900 | $121,500 |
| 2017 | $5,410 | $266,500 | $145,000 | $121,500 |
| 2016 | $5,437 | $266,500 | $145,000 | $121,500 |
| 2015 | $5,303 | $266,500 | $145,000 | $121,500 |
| 2014 | $5,282 | $265,300 | $145,000 | $120,300 |
| 2013 | $5,215 | $265,400 | $145,000 | $120,400 |
Source: Public Records
Map
Nearby Homes
- 133R Stratham Heights Rd
- 50 Thornhill Rd
- 16 Parkman Brook Ln
- Homesite 1 Windsong Place
- Homesite 4 Windsong Place
- 91 Lovering Rd
- 8 Winterberry Ln
- 2 Sterling Hill Ln Unit 211
- 1 Sterling Hill Ln Unit 116
- 5 Sterling Hill Ln Unit 531
- 5 Sterling Hill Ln Unit 514
- 5 Sterling Hill Ln Unit 545
- 3 Sterling Hill Ln Unit 324
- 31 Pinewood Dr
- 135 Exeter Rd
- 131 Exeter Rd
- 101 Robinhood Dr
- 113 Exeter Rd
- 43 Hampton Rd
- 19 1st St
- 2 Holmgren Ct
- 3 Holmgren Ct
- 15 Holmgren Rd
- 1 Holmgren Ct
- 1 Holmgren Ct Unit 18
- 13 Holmgren Rd
- 17 Holmgren Rd
- 133 Stratham Heights Rd
- 12 Holmgren Rd
- 14 Holmgren Rd
- 11 Holmgren Rd
- 149 Stratham Heights Rd
- 145 Stratham Heights Rd
- 147 Stratham Heights Rd
- 16 Holmgren Rd
- 141 Stratham Heights Rd
- 9 Holmgren Rd
- 10 Holmgren Rd
- 151 Stratham Heights Rd
- 18 Holmgren Rd