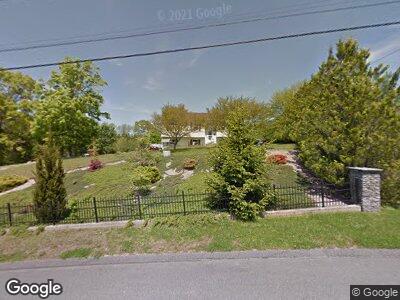
4 Horizon Terrace Westerly, RI 02891
Estimated Value: $457,771 - $548,000
3
Beds
2
Baths
1,080
Sq Ft
$473/Sq Ft
Est. Value
About This Home
This home is located at 4 Horizon Terrace, Westerly, RI 02891 and is currently estimated at $510,693, approximately $472 per square foot. 4 Horizon Terrace is a home located in Washington County with nearby schools including Westerly High School, North Stonington Christian Academy, and St. Michael School.
Ownership History
Date
Name
Owned For
Owner Type
Purchase Details
Closed on
Feb 26, 2019
Sold by
Manfredi Joseph C and Manfredi Jessica L
Bought by
Manfredi Joseph C
Current Estimated Value
Purchase Details
Closed on
Jul 28, 2006
Sold by
Luzzi Mario T
Bought by
Manfredi Joseph C and Manfredi Jessica L
Home Financials for this Owner
Home Financials are based on the most recent Mortgage that was taken out on this home.
Original Mortgage
$294,500
Interest Rate
6.67%
Mortgage Type
Purchase Money Mortgage
Purchase Details
Closed on
Jun 30, 1997
Sold by
Lee De Jong and Lee Alri
Bought by
Luzzi Mario T
Purchase Details
Closed on
Jan 10, 1994
Sold by
Woody Hl Homes Inc
Bought by
Lee Se Jong and Lee Aeri
Create a Home Valuation Report for This Property
The Home Valuation Report is an in-depth analysis detailing your home's value as well as a comparison with similar homes in the area
Home Values in the Area
Average Home Value in this Area
Purchase History
| Date | Buyer | Sale Price | Title Company |
|---|---|---|---|
| Manfredi Joseph C | -- | -- | |
| Manfredi Joseph C | $310,000 | -- | |
| Luzzi Mario T | $117,000 | -- | |
| Lee Se Jong | $120,000 | -- |
Source: Public Records
Mortgage History
| Date | Status | Borrower | Loan Amount |
|---|---|---|---|
| Open | Manfredi Joseph C | $60,000 | |
| Open | Manfredi Joseph C | $242,500 | |
| Previous Owner | Manfredi Joseph C | $251,230 | |
| Previous Owner | Lee Se Jong | $294,500 | |
| Previous Owner | Lee Se Jong | $237,500 | |
| Previous Owner | Lee Se Jong | $225,000 |
Source: Public Records
Tax History Compared to Growth
Tax History
| Year | Tax Paid | Tax Assessment Tax Assessment Total Assessment is a certain percentage of the fair market value that is determined by local assessors to be the total taxable value of land and additions on the property. | Land | Improvement |
|---|---|---|---|---|
| 2024 | $3,652 | $349,500 | $148,600 | $200,900 |
| 2023 | $3,551 | $349,500 | $148,600 | $200,900 |
| 2022 | $3,530 | $349,500 | $148,600 | $200,900 |
| 2021 | $3,467 | $287,500 | $129,400 | $158,100 |
| 2020 | $3,407 | $287,500 | $129,400 | $158,100 |
| 2019 | $3,375 | $287,500 | $129,400 | $158,100 |
| 2018 | $3,264 | $264,300 | $129,400 | $134,900 |
| 2017 | $3,172 | $264,300 | $129,400 | $134,900 |
| 2016 | $3,172 | $264,300 | $129,400 | $134,900 |
| 2015 | $3,147 | $280,200 | $138,200 | $142,000 |
| 2014 | $3,096 | $280,200 | $138,200 | $142,000 |
Source: Public Records
Map
Nearby Homes
- 4 Branberry Dr
- 28 Potter Hill Rd
- 37 Potter Hill Rd
- 223 High St Unit S
- 94 Ashaway Rd
- 6 Doreen Dr
- 43 Beatrice St
- 30 Saundra Dr
- 103 Ashaway Rd
- 101 Ashaway Rd
- 141 Canal St
- 12 Marion St
- 7 Maggio Ave
- 140 High St Unit 108
- 5 Cottage St
- 21 White Rock Rd
- 84 Pierce St
- 67 Pleasant St
- 48 Batterson Ave
- 52 Spruce St
- 4 Horizon Terrace
- 6 Horizon Terrace
- 2 Horizon Terrace
- 25 Nichols Ln
- 27 Nichols Ln
- 1 Horizon Terrace
- 3 Horizon Terrace
- 23 Nichols Ln
- 8 Horizon Terrace
- 291 High St
- 285 High St
- 5 Horizon Terrace
- 297 High St
- 22 Nichols Ln
- 3 Laurel Hill Dr
- 299 High St
- 299 High St Unit B
- 21 Nichols Ln
- 1 Laurel Hill Dr
- 5 Laurel Hill Dr