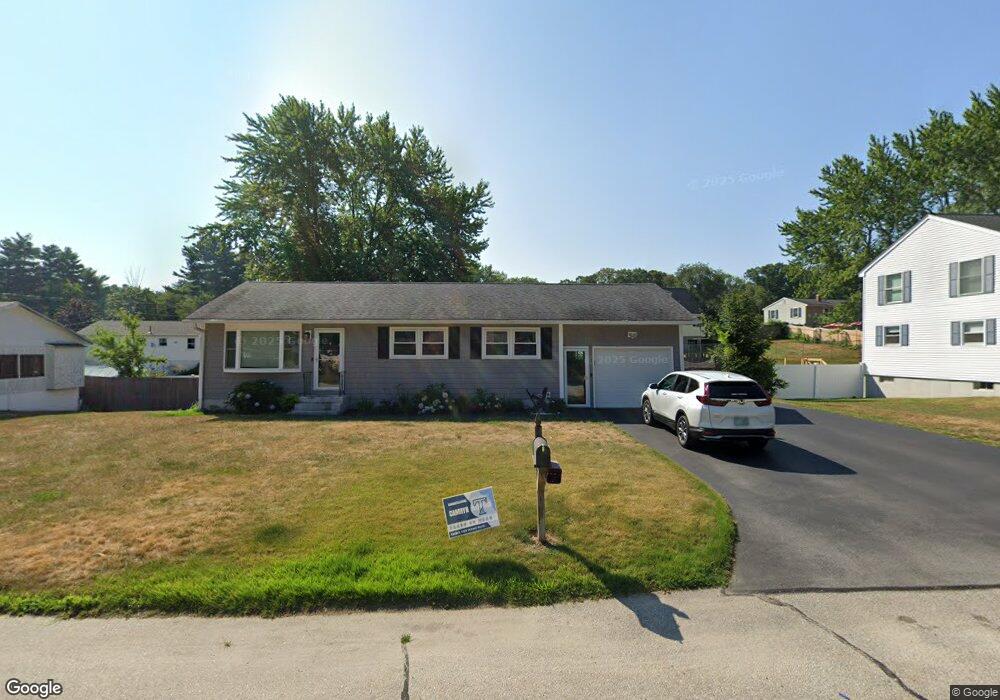
4 Iroquois Rd Nashua, NH 03063
Northwest Nashua NeighborhoodEstimated Value: $489,000 - $585,000
3
Beds
2
Baths
1,060
Sq Ft
$496/Sq Ft
Est. Value
About This Home
This home is located at 4 Iroquois Rd, Nashua, NH 03063 and is currently estimated at $525,329, approximately $495 per square foot. 4 Iroquois Rd is a home located in Hillsborough County with nearby schools including Broad Street Elementary School, Elm Street Middle School, and Nashua High School North.
Ownership History
Date
Name
Owned For
Owner Type
Purchase Details
Closed on
Sep 11, 2009
Sold by
Smith Jeffrey A and Smith Luane R
Bought by
Prunier Scott P and Prunier Lori B
Current Estimated Value
Home Financials for this Owner
Home Financials are based on the most recent Mortgage that was taken out on this home.
Original Mortgage
$232,707
Outstanding Balance
$153,498
Interest Rate
5.36%
Mortgage Type
Purchase Money Mortgage
Estimated Equity
$371,831
Purchase Details
Closed on
Dec 10, 2004
Sold by
Walsh Robert R and Walsh Sandra J
Bought by
Smith Luane R and Smith Jeffrey A
Home Financials for this Owner
Home Financials are based on the most recent Mortgage that was taken out on this home.
Original Mortgage
$236,600
Interest Rate
5.63%
Mortgage Type
Purchase Money Mortgage
Create a Home Valuation Report for This Property
The Home Valuation Report is an in-depth analysis detailing your home's value as well as a comparison with similar homes in the area
Home Values in the Area
Average Home Value in this Area
Purchase History
| Date | Buyer | Sale Price | Title Company |
|---|---|---|---|
| Prunier Scott P | $237,000 | -- | |
| Smith Luane R | $262,900 | -- |
Source: Public Records
Mortgage History
| Date | Status | Borrower | Loan Amount |
|---|---|---|---|
| Open | Smith Luane R | $232,707 | |
| Previous Owner | Smith Luane R | $198,000 | |
| Previous Owner | Smith Luane R | $236,600 |
Source: Public Records
Tax History Compared to Growth
Tax History
| Year | Tax Paid | Tax Assessment Tax Assessment Total Assessment is a certain percentage of the fair market value that is determined by local assessors to be the total taxable value of land and additions on the property. | Land | Improvement |
|---|---|---|---|---|
| 2024 | $7,448 | $468,400 | $160,400 | $308,000 |
| 2023 | $7,143 | $391,800 | $128,400 | $263,400 |
| 2022 | $7,080 | $391,800 | $128,400 | $263,400 |
| 2021 | $6,146 | $264,700 | $85,600 | $179,100 |
| 2020 | $6,023 | $266,400 | $85,600 | $180,800 |
| 2019 | $5,797 | $266,400 | $85,600 | $180,800 |
| 2018 | $5,650 | $266,400 | $85,600 | $180,800 |
| 2017 | $5,416 | $210,000 | $69,900 | $140,100 |
| 2016 | $5,265 | $210,000 | $69,900 | $140,100 |
| 2015 | $5,151 | $210,000 | $69,900 | $140,100 |
| 2014 | $5,051 | $210,000 | $69,900 | $140,100 |
Source: Public Records
Map
Nearby Homes
- 239 Broad St
- 424 Broad St
- 5 Meghan Dr Unit U23
- 14 Parrish Hill Dr
- 6 Cornwall Ln Unit 7
- 4 Nelson St
- 27 Country Hill Rd Unit U90
- 3 Richmond St
- 247 Main Dunstable Rd
- 599 W Hollis St
- 8 Althea Ln Unit U26
- 36 Hampton Dr
- 41 New Dunstable Rd Unit 371
- 22 New Dunstable Rd Unit 132133
- 19 Dunloggin Rd
- 4 Jared Cir Unit U21
- 5 Chatfield Dr Unit U18
- 7 Robert Dr
- 47 Dogwood Dr Unit U202
- 46 Scenic Dr