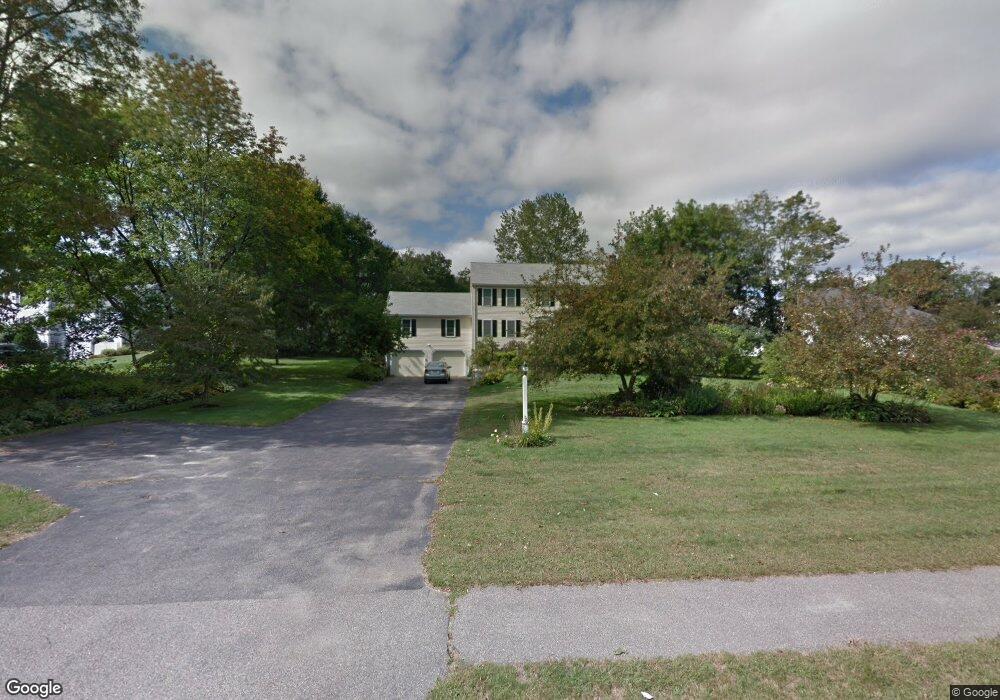
4 Jencks Rd Milford, MA 01757
Estimated Value: $699,000 - $926,000
3
Beds
3
Baths
2,760
Sq Ft
$284/Sq Ft
Est. Value
About This Home
This home is located at 4 Jencks Rd, Milford, MA 01757 and is currently estimated at $784,664, approximately $284 per square foot. 4 Jencks Rd is a home located in Worcester County with nearby schools including Milford High School and Bethany Christian Academy.
Ownership History
Date
Name
Owned For
Owner Type
Purchase Details
Closed on
Jan 7, 2025
Sold by
Sherman James M and Sherman Lisa S
Bought by
Sherman
Current Estimated Value
Purchase Details
Closed on
Feb 4, 1994
Sold by
D&F Afonso Rt and Afonso Omingos
Bought by
Sherman James M and Sherman Lisa S
Home Financials for this Owner
Home Financials are based on the most recent Mortgage that was taken out on this home.
Original Mortgage
$80,000
Interest Rate
7.12%
Mortgage Type
Purchase Money Mortgage
Create a Home Valuation Report for This Property
The Home Valuation Report is an in-depth analysis detailing your home's value as well as a comparison with similar homes in the area
Home Values in the Area
Average Home Value in this Area
Purchase History
| Date | Buyer | Sale Price | Title Company |
|---|---|---|---|
| Sherman | -- | None Available | |
| Sherman | -- | None Available | |
| Sherman James M | $205,000 | -- | |
| Sherman James M | $205,000 | -- |
Source: Public Records
Mortgage History
| Date | Status | Borrower | Loan Amount |
|---|---|---|---|
| Previous Owner | Sherman James M | $100,000 | |
| Previous Owner | Sherman James M | $80,000 |
Source: Public Records
Tax History
| Year | Tax Paid | Tax Assessment Tax Assessment Total Assessment is a certain percentage of the fair market value that is determined by local assessors to be the total taxable value of land and additions on the property. | Land | Improvement |
|---|---|---|---|---|
| 2025 | $8,771 | $685,200 | $227,700 | $457,500 |
| 2024 | $8,668 | $652,200 | $219,000 | $433,200 |
| 2023 | $8,053 | $557,300 | $181,900 | $375,400 |
| 2022 | $7,573 | $492,100 | $166,600 | $325,500 |
| 2021 | $7,213 | $451,400 | $166,600 | $284,800 |
| 2020 | $7,121 | $446,200 | $166,600 | $279,600 |
| 2019 | $6,925 | $418,700 | $166,600 | $252,100 |
| 2018 | $6,862 | $414,400 | $162,300 | $252,100 |
| 2017 | $6,635 | $395,200 | $162,300 | $232,900 |
| 2016 | $6,518 | $379,400 | $162,300 | $217,100 |
| 2015 | $6,509 | $370,900 | $162,300 | $208,600 |
Source: Public Records
Map
Nearby Homes
- 15 Black Bear Cir Unit 15
- 13 Black Bear Cir Unit 13
- 44 Black Bear Cir Unit 44
- 11 Black Bear Unit 11
- 46 Black Bear Cir Unit 46
- 9 Black Bear Cir Unit 9
- 43 Black Bear Cir Unit 43
- 16 Black Bear Cir Unit 16
- 48 Black Bear Cir Unit 48
- 7 Black Bear Unit 7
- 3 Black Bear Cir Unit 3
- 10 Black Bear Unit 10
- 7 Woodland Ct Unit B
- 4 Waterfall Ln
- 35 Woodland Ave Unit 35A
- 15 Fox Run Rd
- 190-194 E Main St
- 22 Granite St
- 21 Carp Rd
- 6 Jen Paul Way Unit B
Your Personal Tour Guide
Ask me questions while you tour the home.