J
Seller's Agent in 2015
Janet Davis
Estimated Value: $410,000 - $514,000
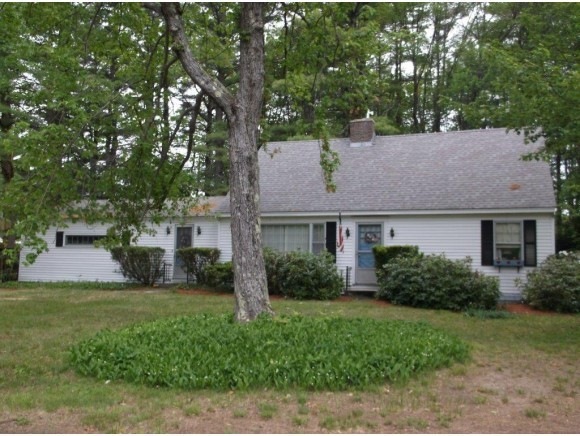
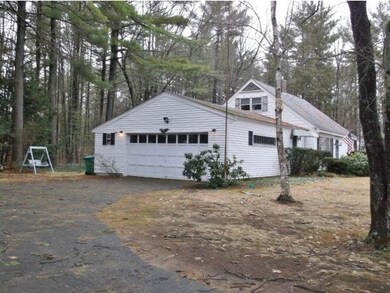
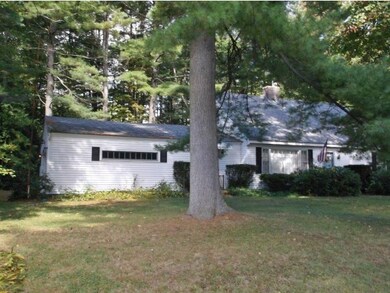
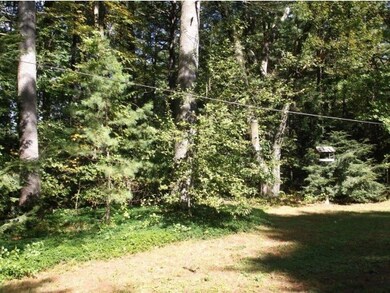
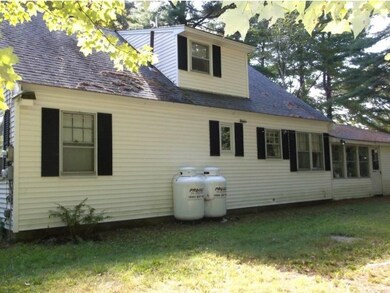
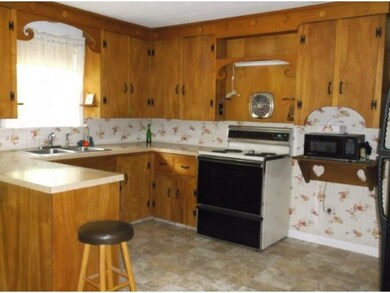
4 BR, 2 BA CAPE WITH 2 CAR ATTACHED GARAGE N .38 ACRE LOT IN AN EXCELLENT NEIGHBORHOOD. NEW HEATING SYSTEM, HARDWOOD FLOORS, FIREPLACE W/WOOD STOVE, LARGE KITCHEN WITH APPLIANCES. REAR PORCH.
Last Agent to Sell the Property
Janet Davis
License #001846 Listed on: 09/21/2014
| Date | Buyer | Sale Price | Title Company |
|---|---|---|---|
| Miller Gina M | $169,933 | -- |
| Date | Status | Borrower | Loan Amount |
|---|---|---|---|
| Open | Miller Gina M | $166,822 |
| Date | Event | Price | List to Sale | Price per Sq Ft |
|---|---|---|---|---|
| 08/21/2015 08/21/15 | Sold | $169,900 | -7.9% | $94 / Sq Ft |
| 07/18/2015 07/18/15 | Pending | -- | -- | -- |
| 09/21/2014 09/21/14 | For Sale | $184,500 | -- | $103 / Sq Ft |
| Year | Tax Paid | Tax Assessment Tax Assessment Total Assessment is a certain percentage of the fair market value that is determined by local assessors to be the total taxable value of land and additions on the property. | Land | Improvement |
|---|---|---|---|---|
| 2024 | $5,549 | $373,700 | $111,200 | $262,500 |
| 2023 | $5,804 | $225,500 | $61,200 | $164,300 |
| 2022 | $4,619 | $182,700 | $61,200 | $121,500 |
| 2021 | $4,504 | $182,700 | $61,200 | $121,500 |
| 2020 | $4,499 | $182,800 | $61,200 | $121,600 |
| 2019 | $4,552 | $182,800 | $61,200 | $121,600 |
| 2018 | $4,191 | $152,300 | $40,800 | $111,500 |
| 2017 | $4,010 | $152,300 | $40,800 | $111,500 |
| 2016 | $3,708 | $131,200 | $40,800 | $90,400 |
| 2015 | $3,600 | $127,900 | $40,800 | $87,100 |
| 2014 | $3,513 | $127,900 | $40,800 | $87,100 |
| 2013 | $4,397 | $166,800 | $54,400 | $112,400 |
| 2012 | $4,283 | $166,800 | $54,400 | $112,400 |
J
Seller's Agent in 2015
Janet Davis

Buyer's Agent in 2015
Maria Shute
RE/MAX
(603) 498-8460
10 in this area
80 Total Sales
Source: PrimeMLS
MLS Number: 4385307
APN: RCHE-000139-000004
Disclaimer: Certain information contained herein is derived from information provided by parties other than Homes.com. All information provided is deemed reliable, but is not guaranteed to be accurate and should be independently verified.
![]() Copyright 2025 PrimeMLS, Inc. All rights reserved. This information is deemed reliable, but not guaranteed. The data relating to real estate displayed on this display comes in part from the IDX Program of PrimeMLS. The information being provided is for consumers’ personal, non-commercial use and may not be used for any purpose other than to identify prospective properties consumers may be interested in purchasing.
Copyright 2025 PrimeMLS, Inc. All rights reserved. This information is deemed reliable, but not guaranteed. The data relating to real estate displayed on this display comes in part from the IDX Program of PrimeMLS. The information being provided is for consumers’ personal, non-commercial use and may not be used for any purpose other than to identify prospective properties consumers may be interested in purchasing.