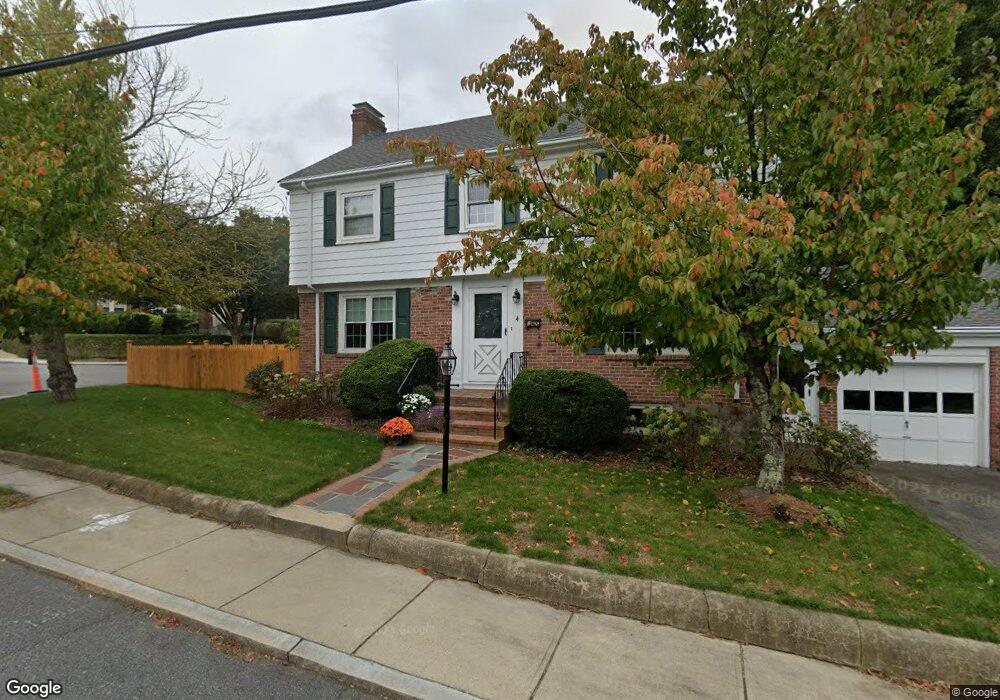
4 Lantern Ln West Roxbury, MA 02132
West Roxbury NeighborhoodEstimated Value: $988,372 - $1,175,000
4
Beds
3
Baths
1,971
Sq Ft
$553/Sq Ft
Est. Value
About This Home
This home is located at 4 Lantern Ln, West Roxbury, MA 02132 and is currently estimated at $1,089,593, approximately $552 per square foot. 4 Lantern Ln is a home located in Suffolk County with nearby schools including Brooke Charter School Roslindale, Holy Name Parish School, and St Theresa School.
Ownership History
Date
Name
Owned For
Owner Type
Purchase Details
Closed on
Dec 18, 2023
Sold by
Burke Leo J and Burke Sheila A
Bought by
Burke Ret and Burke
Current Estimated Value
Purchase Details
Closed on
Dec 29, 1989
Sold by
Haich Barbara
Bought by
Burke Leo J
Home Financials for this Owner
Home Financials are based on the most recent Mortgage that was taken out on this home.
Original Mortgage
$187,500
Interest Rate
9.61%
Mortgage Type
Purchase Money Mortgage
Create a Home Valuation Report for This Property
The Home Valuation Report is an in-depth analysis detailing your home's value as well as a comparison with similar homes in the area
Home Values in the Area
Average Home Value in this Area
Purchase History
| Date | Buyer | Sale Price | Title Company |
|---|---|---|---|
| Burke Ret | -- | None Available | |
| Burke Leo J | $240,000 | -- |
Source: Public Records
Mortgage History
| Date | Status | Borrower | Loan Amount |
|---|---|---|---|
| Previous Owner | Burke Leo J | $178,200 | |
| Previous Owner | Burke Leo J | $184,000 | |
| Previous Owner | Burke Leo J | $187,500 |
Source: Public Records
Tax History Compared to Growth
Tax History
| Year | Tax Paid | Tax Assessment Tax Assessment Total Assessment is a certain percentage of the fair market value that is determined by local assessors to be the total taxable value of land and additions on the property. | Land | Improvement |
|---|---|---|---|---|
| 2025 | $10,014 | $864,800 | $258,100 | $606,700 |
| 2024 | $10,777 | $988,700 | $275,400 | $713,300 |
| 2023 | $10,111 | $941,400 | $262,200 | $679,200 |
| 2022 | $9,393 | $863,300 | $240,400 | $622,900 |
| 2021 | $8,682 | $813,700 | $231,200 | $582,500 |
| 2020 | $7,412 | $701,900 | $210,300 | $491,600 |
| 2019 | $6,980 | $662,200 | $174,800 | $487,400 |
| 2018 | $6,610 | $630,700 | $174,800 | $455,900 |
| 2017 | $6,611 | $624,300 | $174,800 | $449,500 |
| 2016 | $6,419 | $583,500 | $174,800 | $408,700 |
| 2015 | $6,656 | $549,600 | $168,000 | $381,600 |
| 2014 | $6,397 | $508,500 | $168,000 | $340,500 |
Source: Public Records
Map
Nearby Homes
- 10 Burwell Rd
- 10 Hackensack Terrace
- 104 Greaton Rd
- 87 Knoll St
- 26 Bradfield Ave Unit 3
- 24 Hazelmere Rd
- 214 Allandale Rd Unit B
- 311 Belgrade Ave
- 206 Allandale Rd Unit 3C
- 257 Belgrade Ave
- 83 Payson Rd
- 242 Belgrade Ave
- 232 Allandale Rd Unit 2D
- 416 Belgrade Ave Unit 25
- 15 Newburg St Unit 1
- 79 Robert St Unit 3
- 168 Maple St
- 95 Newburg St
- 173 South St
- 2 Weld Hill St Unit PH2