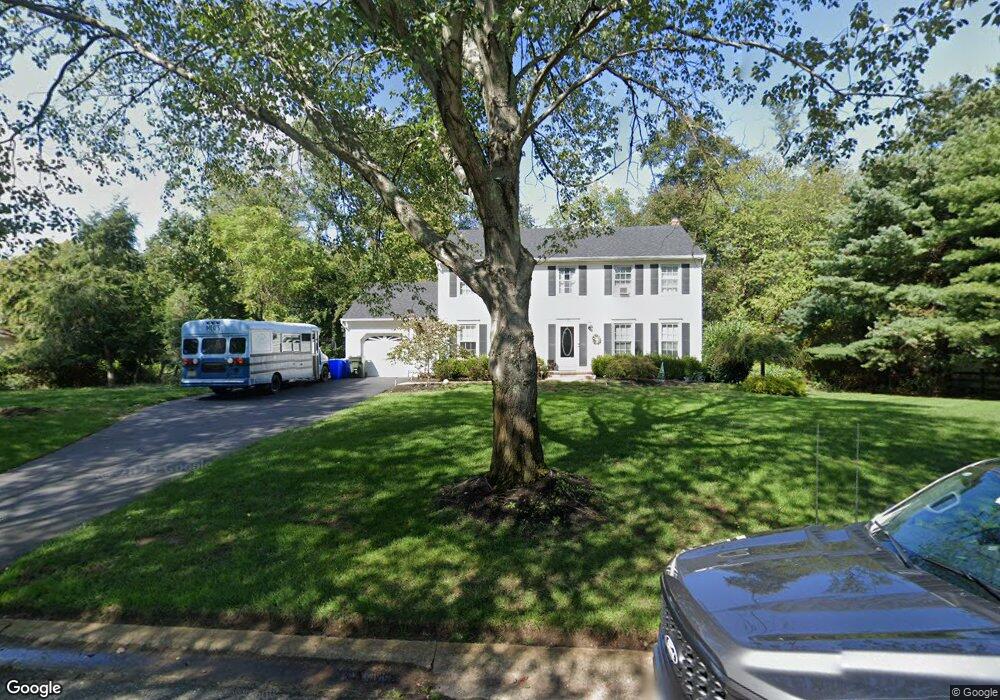
4 Mcqueen Blvd Farmingdale, NJ 07727
Adelphia NeighborhoodEstimated Value: $725,520 - $771,000
4
Beds
3
Baths
2,032
Sq Ft
$371/Sq Ft
Est. Value
About This Home
This home is located at 4 Mcqueen Blvd, Farmingdale, NJ 07727 and is currently estimated at $754,880, approximately $371 per square foot. 4 Mcqueen Blvd is a home located in Monmouth County with nearby schools including Ardena School, Adelphia Elementary School, and Howell Middle School North.
Ownership History
Date
Name
Owned For
Owner Type
Purchase Details
Closed on
Nov 25, 2019
Sold by
Squires Tracey E and Estate Of Raecele Fishson
Bought by
Kaplan Joel S and Kaplan Sarah
Current Estimated Value
Home Financials for this Owner
Home Financials are based on the most recent Mortgage that was taken out on this home.
Original Mortgage
$262,530
Interest Rate
3.74%
Mortgage Type
New Conventional
Create a Home Valuation Report for This Property
The Home Valuation Report is an in-depth analysis detailing your home's value as well as a comparison with similar homes in the area
Home Values in the Area
Average Home Value in this Area
Purchase History
| Date | Buyer | Sale Price | Title Company |
|---|---|---|---|
| Kaplan Joel S | $380,000 | Clear To Close Title Svcs |
Source: Public Records
Mortgage History
| Date | Status | Borrower | Loan Amount |
|---|---|---|---|
| Previous Owner | Kaplan Joel S | $262,530 |
Source: Public Records
Tax History Compared to Growth
Tax History
| Year | Tax Paid | Tax Assessment Tax Assessment Total Assessment is a certain percentage of the fair market value that is determined by local assessors to be the total taxable value of land and additions on the property. | Land | Improvement |
|---|---|---|---|---|
| 2025 | $9,871 | $633,300 | $369,200 | $264,100 |
| 2024 | $7,899 | $564,400 | $305,200 | $259,200 |
| 2023 | $7,899 | $431,400 | $178,200 | $253,200 |
| 2022 | $8,275 | $405,300 | $164,200 | $241,100 |
| 2021 | $8,316 | $366,800 | $152,400 | $214,400 |
| 2020 | $8,316 | $364,400 | $152,400 | $212,000 |
| 2019 | $8,407 | $360,800 | $152,400 | $208,400 |
| 2018 | $8,226 | $351,100 | $152,400 | $198,700 |
| 2017 | $8,560 | $361,500 | $152,400 | $209,100 |
| 2016 | $8,485 | $353,400 | $144,200 | $209,200 |
| 2015 | $8,446 | $348,000 | $144,200 | $203,800 |
| 2014 | $7,934 | $301,200 | $139,200 | $162,000 |
Source: Public Records
Map
Nearby Homes