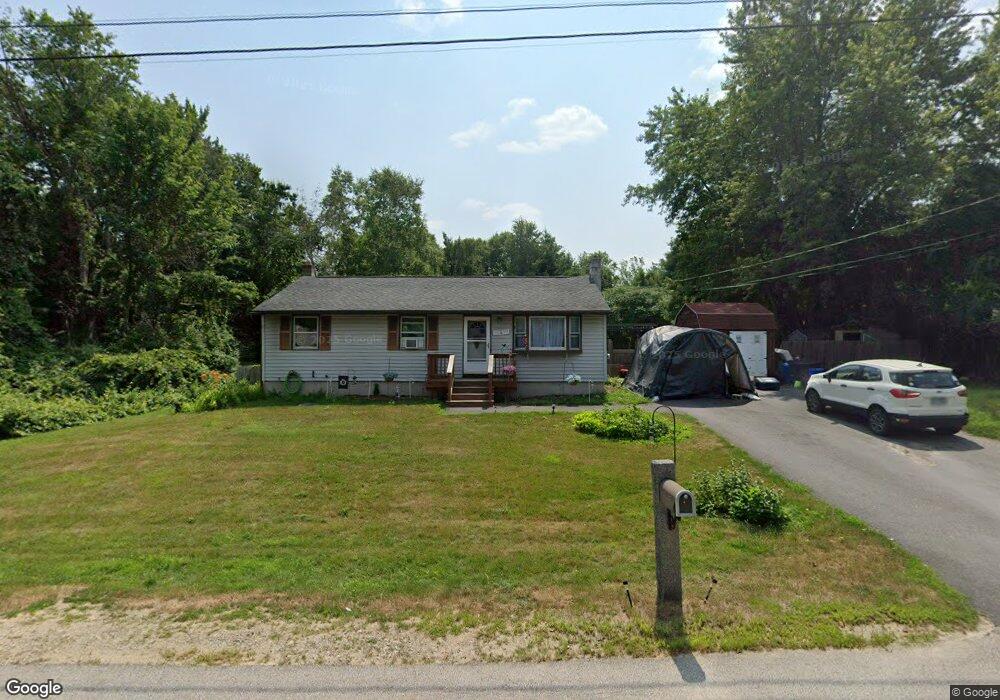
4 Meadow Ct Raymond, NH 03077
Estimated Value: $408,000 - $434,880
3
Beds
1
Bath
960
Sq Ft
$443/Sq Ft
Est. Value
About This Home
This home is located at 4 Meadow Ct, Raymond, NH 03077 and is currently estimated at $425,720, approximately $443 per square foot. 4 Meadow Ct is a home located in Rockingham County with nearby schools including Lamprey River Elementary School, Iber Holmes Gove Middle School, and Raymond High School.
Ownership History
Date
Name
Owned For
Owner Type
Purchase Details
Closed on
Mar 19, 2012
Sold by
Fnma
Bought by
Grady Sharon F
Current Estimated Value
Purchase Details
Closed on
Sep 30, 2011
Sold by
Cashman Beth L and Fnma
Bought by
Federal National Mortgage Association
Purchase Details
Closed on
Jul 30, 2004
Sold by
Menns Scott A and Menns Lauren J
Bought by
Cashman William G and Cashman Beth L
Home Financials for this Owner
Home Financials are based on the most recent Mortgage that was taken out on this home.
Original Mortgage
$230,000
Interest Rate
6.33%
Mortgage Type
Purchase Money Mortgage
Purchase Details
Closed on
Jun 17, 1999
Sold by
Booth Charles G and Booth Cheryl L
Bought by
Menns Scott A and Menns Lauren J
Create a Home Valuation Report for This Property
The Home Valuation Report is an in-depth analysis detailing your home's value as well as a comparison with similar homes in the area
Home Values in the Area
Average Home Value in this Area
Purchase History
| Date | Buyer | Sale Price | Title Company |
|---|---|---|---|
| Grady Sharon F | $133,000 | -- | |
| Grady Sharon F | $133,000 | -- | |
| Federal National Mortgage Association | $179,100 | -- | |
| Federal National Mortgage Association | $179,100 | -- | |
| Cashman William G | $230,000 | -- | |
| Cashman William G | $230,000 | -- | |
| Menns Scott A | $117,900 | -- | |
| Menns Scott A | $117,900 | -- |
Source: Public Records
Mortgage History
| Date | Status | Borrower | Loan Amount |
|---|---|---|---|
| Previous Owner | Menns Scott A | $45,000 | |
| Previous Owner | Menns Scott A | $230,000 |
Source: Public Records
Tax History Compared to Growth
Tax History
| Year | Tax Paid | Tax Assessment Tax Assessment Total Assessment is a certain percentage of the fair market value that is determined by local assessors to be the total taxable value of land and additions on the property. | Land | Improvement |
|---|---|---|---|---|
| 2024 | $6,003 | $274,000 | $117,800 | $156,200 |
| 2023 | $5,677 | $274,000 | $117,800 | $156,200 |
| 2022 | $5,011 | $274,000 | $117,800 | $156,200 |
| 2021 | $5,072 | $274,000 | $117,800 | $156,200 |
| 2020 | $5,285 | $201,700 | $84,300 | $117,400 |
| 2019 | $5,363 | $201,700 | $84,300 | $117,400 |
| 2018 | $5,283 | $200,500 | $84,300 | $116,200 |
| 2017 | $4,852 | $200,500 | $84,300 | $116,200 |
| 2016 | $4,757 | $200,400 | $84,300 | $116,100 |
| 2015 | $4,577 | $182,500 | $84,300 | $98,200 |
| 2014 | $4,440 | $182,500 | $84,300 | $98,200 |
| 2013 | $4,262 | $180,300 | $84,300 | $96,000 |
Source: Public Records
Map
Nearby Homes
- 8 Sherman Dr
- 28 Blackstone Dr
- 0 Lane Rd Unit 39
- 15 Bald Hill Rd
- 7 Bald Hill Rd
- 3 Saddlepath Rd
- 19 Bald Hill Rd
- 40 Bald Hill Rd
- 16 Saddle Path Rd
- 15 Sargent Dr
- 24 Kendall Ln
- 297 Crowley Rd
- 00 Dump Rd Unit 20
- 7 Merrick Rd
- 360 Candia Rd
- 0 Eastside Dr
- 29 Batchelder Rd
- 237 Villager Rd
- 244 Villager Rd
- 335 Raymond Rd
- 3 Meadow Ct
- 6 Meadow Ct
- 5 Meadow Ct
- 1 Meadow Ct
- 4 Old Bye Rd
- 7 Meadow Ct
- 8 Meadow Ct
- 111 Lane Rd
- 1 Nancy Ln
- 2 Old Bye Rd
- 9 Meadow Ct
- 7 Old Bye Rd
- 6 Russell Ln
- 3 Russell Ln Unit 41
- 6 Russell Ln Unit 43
- 5 Russell Ln Unit 42
- 2 Russell Ln Unit 45
- 2 Russell Ln Unit 45
- 4 Russell Ln Unit 44
- 4 Russell Ln Unit Lot 44