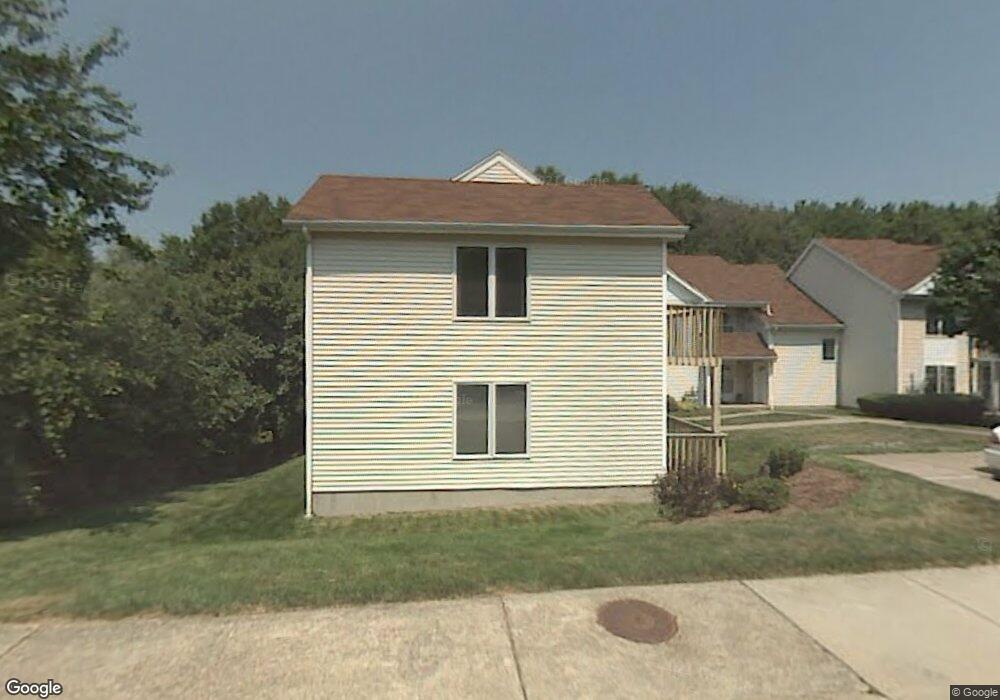
4 Millbrook Ct Newington, CT 06111
Estimated Value: $157,000 - $181,000
1
Bed
1
Bath
752
Sq Ft
$229/Sq Ft
Est. Value
About This Home
This home is located at 4 Millbrook Ct, Newington, CT 06111 and is currently estimated at $172,110, approximately $228 per square foot. 4 Millbrook Ct is a home located in Hartford County with nearby schools including Elizabeth Green School, Martin Kellogg Middle School, and Newington High School.
Ownership History
Date
Name
Owned For
Owner Type
Purchase Details
Closed on
Oct 1, 2024
Sold by
Sousa Lionel G
Bought by
Thibeault Ellen
Current Estimated Value
Purchase Details
Closed on
Aug 27, 2018
Sold by
Odell William J and Odell Mary C
Bought by
Sousa Lionel G
Purchase Details
Closed on
Oct 24, 2014
Sold by
Murray Mary M Est and Monighetti
Bought by
Odell William J and Odell Mary C
Home Financials for this Owner
Home Financials are based on the most recent Mortgage that was taken out on this home.
Original Mortgage
$62,000
Interest Rate
4.1%
Purchase Details
Closed on
Dec 26, 1989
Sold by
Millbrook Village
Bought by
Antan Eleanor M
Home Financials for this Owner
Home Financials are based on the most recent Mortgage that was taken out on this home.
Original Mortgage
$36,000
Interest Rate
9.69%
Mortgage Type
Purchase Money Mortgage
Create a Home Valuation Report for This Property
The Home Valuation Report is an in-depth analysis detailing your home's value as well as a comparison with similar homes in the area
Home Values in the Area
Average Home Value in this Area
Purchase History
| Date | Buyer | Sale Price | Title Company |
|---|---|---|---|
| Thibeault Ellen | $155,000 | None Available | |
| Thibeault Ellen | $155,000 | None Available | |
| Sousa Lionel G | $102,000 | -- | |
| Sousa Lionel G | $102,000 | -- | |
| Odell William J | $87,000 | -- | |
| Odell William J | $87,000 | -- | |
| Antan Eleanor M | $118,050 | -- |
Source: Public Records
Mortgage History
| Date | Status | Borrower | Loan Amount |
|---|---|---|---|
| Previous Owner | Odell William J | $62,000 | |
| Previous Owner | Antan Eleanor M | $36,000 |
Source: Public Records
Tax History
| Year | Tax Paid | Tax Assessment Tax Assessment Total Assessment is a certain percentage of the fair market value that is determined by local assessors to be the total taxable value of land and additions on the property. | Land | Improvement |
|---|---|---|---|---|
| 2025 | $2,573 | $64,360 | $0 | $64,360 |
| 2024 | $2,568 | $64,730 | $0 | $64,730 |
| 2023 | $2,483 | $64,730 | $0 | $64,730 |
| 2022 | $2,491 | $64,730 | $0 | $64,730 |
| 2021 | $2,512 | $64,730 | $0 | $64,730 |
| 2020 | $2,485 | $63,270 | $0 | $63,270 |
| 2019 | $2,496 | $63,270 | $0 | $63,270 |
| 2018 | $2,436 | $63,270 | $0 | $63,270 |
| 2017 | $2,315 | $63,270 | $0 | $63,270 |
| 2016 | $2,262 | $63,270 | $0 | $63,270 |
| 2014 | $2,675 | $76,920 | $0 | $76,920 |
Source: Public Records
Map
Nearby Homes
- 24 Millbrook Ct Unit 24 Millbrook Ct Newi
- 131 Williamstown Ct Unit 131
- 138 Williamstown Ct Unit 138
- 79 Piper Brook Ave
- 32 Garvan St
- 140 Dowd St
- 84 Connecticut Ave
- 42 Sunset Rd
- 25 Dacosta Dr Unit 25
- 39 Schoolhouse Crossing
- 161 Abbotsford Ave
- 43 Marion St
- 25 Lewis Ln
- 575 S Main St
- 15 Cricket Ln
- 38 Northwood Rd
- 20 Browning Ave
- 50 Hillcrest Ave
- 9 Old Farm Dr
- 7 Old Farm Dr
- 4 Millbrook Ct Unit 4
- 2 Millbrook Ct
- 10 Millbrook Ct
- 10 Millbrook Ct Unit 10
- 14 Millbrook Ct
- 14 Millbrook Ct Unit 14
- 16 Millbrook Ct
- 12 Millbrook Ct
- 12 Millbrook Ct Unit 12
- 18 Millbrook Ct
- 8 Millbrook Ct
- 8 Millbrook Ct Unit 8
- 20 Millbrook Ct
- 20 Millbrook Ct Unit 20
- 6 Millbrook Ct
- 22 Millbrook Ct
- 22 Millbrook Ct Unit 22
- 15 Millbrook Ct
- 17 Millbrook Ct
- 17 Millbrook Ct Unit 17
Your Personal Tour Guide
Ask me questions while you tour the home.