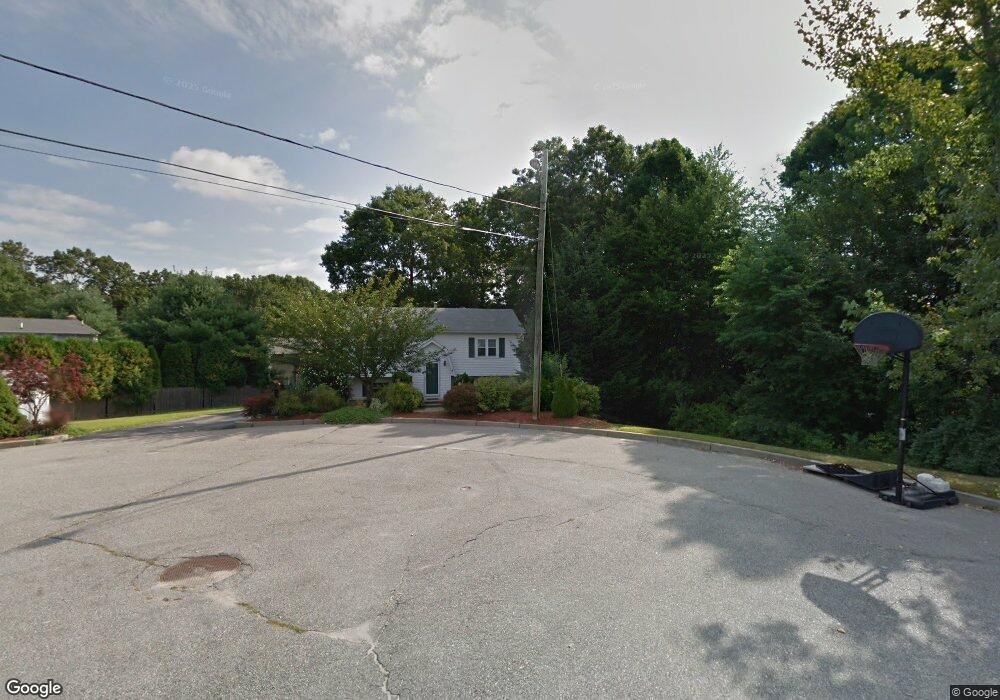
4 Misty Oaks Ct West Warwick, RI 02893
Crompton NeighborhoodEstimated Value: $406,000 - $454,000
3
Beds
2
Baths
1,742
Sq Ft
$243/Sq Ft
Est. Value
About This Home
This home is located at 4 Misty Oaks Ct, West Warwick, RI 02893 and is currently estimated at $424,050, approximately $243 per square foot. 4 Misty Oaks Ct is a home located in Kent County with nearby schools including West Warwick High School and Father John V. Doyle School.
Ownership History
Date
Name
Owned For
Owner Type
Purchase Details
Closed on
Feb 5, 2018
Sold by
Hussey Philip J
Bought by
Hussey Philip J and Hussey Johanna L
Current Estimated Value
Purchase Details
Closed on
Jan 16, 2002
Sold by
Loven Jason B
Bought by
Hussey Philip J
Purchase Details
Closed on
Feb 21, 2001
Sold by
Plage Paul and Plage Gina L
Bought by
Loven Jason B
Purchase Details
Closed on
Dec 19, 1997
Sold by
Catauro Vincent M
Bought by
Marseglia Mario
Create a Home Valuation Report for This Property
The Home Valuation Report is an in-depth analysis detailing your home's value as well as a comparison with similar homes in the area
Home Values in the Area
Average Home Value in this Area
Purchase History
| Date | Buyer | Sale Price | Title Company |
|---|---|---|---|
| Hussey Philip J | -- | -- | |
| Hussey Philip J | $165,000 | -- | |
| Loven Jason B | $143,000 | -- | |
| Marseglia Mario | $85,000 | -- |
Source: Public Records
Mortgage History
| Date | Status | Borrower | Loan Amount |
|---|---|---|---|
| Previous Owner | Marseglia Mario | $100,000 | |
| Previous Owner | Marseglia Mario | $115,000 |
Source: Public Records
Tax History Compared to Growth
Tax History
| Year | Tax Paid | Tax Assessment Tax Assessment Total Assessment is a certain percentage of the fair market value that is determined by local assessors to be the total taxable value of land and additions on the property. | Land | Improvement |
|---|---|---|---|---|
| 2025 | $5,253 | $367,600 | $120,500 | $247,100 |
| 2024 | $5,375 | $287,600 | $95,200 | $192,400 |
| 2023 | $5,269 | $287,600 | $95,200 | $192,400 |
| 2022 | $5,188 | $287,600 | $95,200 | $192,400 |
| 2021 | $5,274 | $229,300 | $76,100 | $153,200 |
| 2020 | $5,274 | $229,300 | $76,100 | $153,200 |
| 2019 | $6,723 | $229,300 | $76,100 | $153,200 |
| 2018 | $4,979 | $183,200 | $74,000 | $109,200 |
| 2017 | $4,820 | $183,200 | $74,000 | $109,200 |
| 2016 | $4,734 | $183,200 | $74,000 | $109,200 |
| 2015 | $4,668 | $179,800 | $74,000 | $105,800 |
| 2014 | $1,141 | $179,800 | $74,000 | $105,800 |
Source: Public Records
Map
Nearby Homes
- 11 Drawbridge Dr
- 25 Wescott Way Unit 80
- 25 Scenic Dr
- 0 New London Turnpike
- 1 Hampton Rd Unit 27
- 105 Scenic Dr
- 19 Hampton Rd Unit 69
- 32 Wescott Way Unit 53
- 40 Wescott Way Unit 57
- 15 Hampton Rd Unit 20
- 65 Angus St
- 5 Pine Hollow Rd
- 1785 Division Rd
- 215 Watch Hill Dr
- 194 Kimberly Ln
- 11 Kennedy Dr
- 35 Beech Crest Rd
- 0 James P Murphy Ind Hwy
- 275 E Shore Dr
- 34 Silverwood Ln
- 66 Cross Bow Ln
- 74 Cross Bow Ln
- 2 Misty Oaks Ct
- 58 Cross Bow Ln
- 1 Misty Oaks Ct
- 82 Cross Bow Ln
- 73 Cross Bow Ln
- 50 Cross Bow Ln
- 65 Cross Bow Ln
- 81 Cross Bow Ln
- 2 Drawbridge Dr
- 3 Drawbridge Dr
- 57 Cross Bow Ln
- 1 Drawbridge Dr
- 92 Cross Bow Ln
- 5 Drawbridge Dr
- 91 Cross Bow Ln
- 42 Cross Bow Ln
- 150 Acorn Ln
- 49 Cross Bow Ln