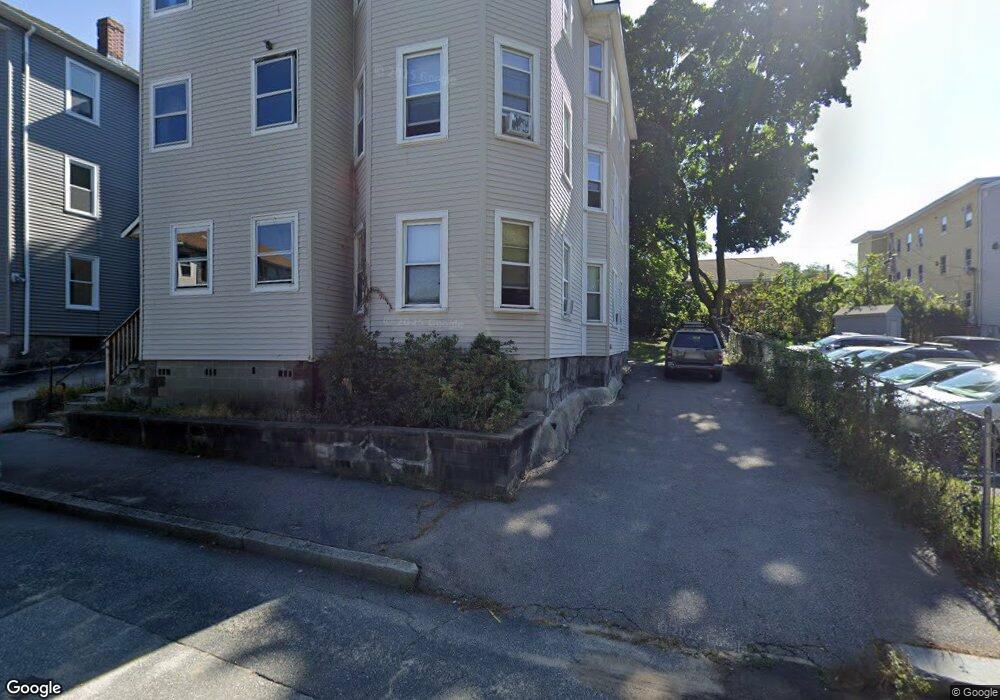
4 Moen St Worcester, MA 01605
Bell Hill NeighborhoodEstimated Value: $638,000 - $732,000
6
Beds
3
Baths
2,904
Sq Ft
$241/Sq Ft
Est. Value
About This Home
This home is located at 4 Moen St, Worcester, MA 01605 and is currently estimated at $700,667, approximately $241 per square foot. 4 Moen St is a home located in Worcester County with nearby schools including City View, Jacob Hiatt Magnet School, and Chandler Magnet.
Ownership History
Date
Name
Owned For
Owner Type
Purchase Details
Closed on
Jul 13, 1995
Sold by
Dime Sb Ny Fsb
Bought by
Fitzgerald Timothy and Dec Theresa
Current Estimated Value
Home Financials for this Owner
Home Financials are based on the most recent Mortgage that was taken out on this home.
Original Mortgage
$35,900
Interest Rate
7.7%
Mortgage Type
Purchase Money Mortgage
Purchase Details
Closed on
Nov 16, 1994
Sold by
Cheung Irene
Bought by
Dime Sb New York Fsb
Create a Home Valuation Report for This Property
The Home Valuation Report is an in-depth analysis detailing your home's value as well as a comparison with similar homes in the area
Home Values in the Area
Average Home Value in this Area
Purchase History
| Date | Buyer | Sale Price | Title Company |
|---|---|---|---|
| Fitzgerald Timothy | $44,900 | -- | |
| Dime Sb New York Fsb | $33,600 | -- |
Source: Public Records
Mortgage History
| Date | Status | Borrower | Loan Amount |
|---|---|---|---|
| Open | Dime Sb New York Fsb | $100,000 | |
| Closed | Dime Sb New York Fsb | $35,900 | |
| Previous Owner | Dime Sb New York Fsb | $11,700 |
Source: Public Records
Tax History
| Year | Tax Paid | Tax Assessment Tax Assessment Total Assessment is a certain percentage of the fair market value that is determined by local assessors to be the total taxable value of land and additions on the property. | Land | Improvement |
|---|---|---|---|---|
| 2025 | $6,803 | $515,800 | $81,200 | $434,600 |
| 2024 | $6,285 | $457,100 | $81,200 | $375,900 |
| 2023 | $6,017 | $419,600 | $70,600 | $349,000 |
| 2022 | $5,237 | $344,300 | $56,500 | $287,800 |
| 2021 | $4,539 | $278,800 | $45,200 | $233,600 |
| 2020 | $3,694 | $217,300 | $44,900 | $172,400 |
| 2019 | $3,670 | $203,900 | $39,200 | $164,700 |
| 2018 | $3,599 | $190,300 | $39,200 | $151,100 |
| 2017 | $3,385 | $176,100 | $39,200 | $136,900 |
| 2016 | $3,207 | $155,600 | $28,300 | $127,300 |
| 2015 | $3,123 | $155,600 | $28,300 | $127,300 |
| 2014 | $3,040 | $155,600 | $28,300 | $127,300 |
Source: Public Records
Map
Nearby Homes
- 139 Lincoln St
- 21 Kendall St
- 3 Perkins St
- Lot 2 Ararat
- 176 Lincoln St Unit 4
- 26 Orne St
- 74 Green Hill Pkwy
- 78 Green Hill Pkwy
- 15 Edward St
- 145 Eastern Ave
- 27 Harlow St
- 63 North St Unit D
- 63 North St Unit C
- 63 North St Unit B
- 63 North St Unit A
- 5 State St Unit 1
- 249 Lincoln St
- 47 Laurel St
- 20B Edgeworth St
- 15 Breck St
- 6 Moen St
- 6 Moen St Unit 2
- 6 Moen St Unit 1
- 6 Moen St Unit 3
- 2 1/2 Henchman St
- 8 Moen St
- 9 Moen St
- 9 Moen St Unit 3
- 9 Moen St Unit 2
- 9 Moen St Unit 1
- 9 Moen Unit 2
- 11 Moen St
- 8 Henchman Terrace Unit 1
- 8 Henchman Terrace
- 10 Henchman St
- 2-4 Henchman St
- 3 Henchman St
- 114 Lincoln St
- 3 Henchman St
- 11 Henchman St
Your Personal Tour Guide
Ask me questions while you tour the home.