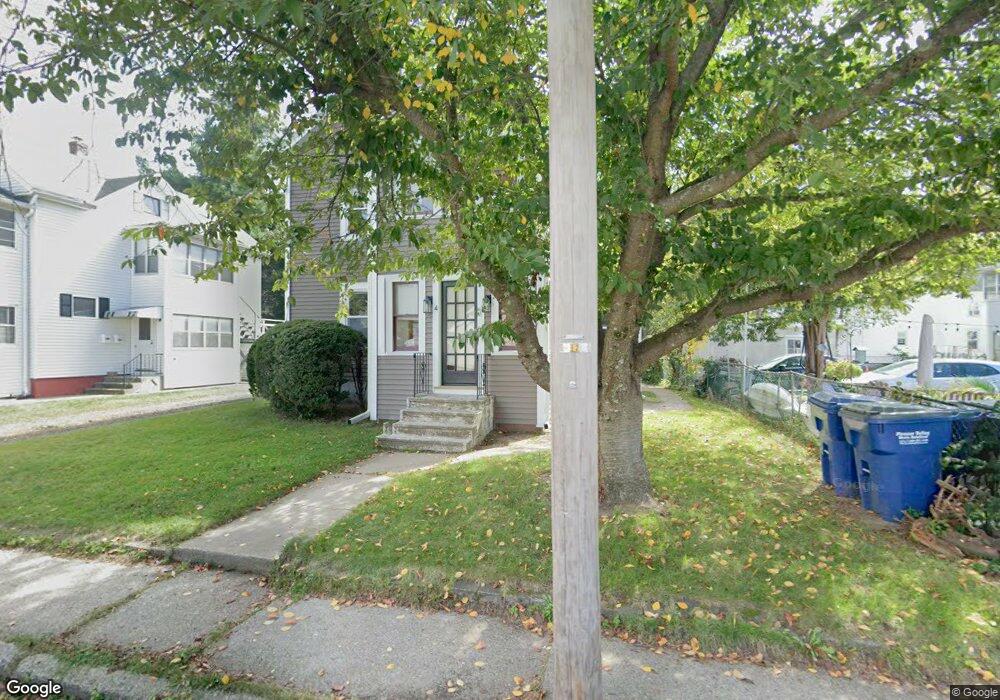
4 Princeton Ave Easthampton, MA 01027
Estimated Value: $325,000 - $422,000
4
Beds
4
Baths
1,632
Sq Ft
$220/Sq Ft
Est. Value
About This Home
This home is located at 4 Princeton Ave, Easthampton, MA 01027 and is currently estimated at $358,882, approximately $219 per square foot. 4 Princeton Ave is a home located in Hampshire County with nearby schools including Easthampton High School, Hilltown Cooperative Charter Public School, and Tri-County Schools.
Ownership History
Date
Name
Owned For
Owner Type
Purchase Details
Closed on
May 21, 2010
Sold by
Wals Thomas J and Wals Fhlmc
Bought by
Heath Mark D and Heath Kristen
Current Estimated Value
Home Financials for this Owner
Home Financials are based on the most recent Mortgage that was taken out on this home.
Original Mortgage
$126,375
Outstanding Balance
$85,447
Interest Rate
5.23%
Mortgage Type
Purchase Money Mortgage
Estimated Equity
$273,435
Purchase Details
Closed on
Oct 13, 2009
Sold by
Pinard Beth J and Mers
Bought by
Fhlmc
Purchase Details
Closed on
Jun 15, 2001
Sold by
Duffney Charles L
Bought by
Delisle Dominic and Pinard-Delisle Beth J
Home Financials for this Owner
Home Financials are based on the most recent Mortgage that was taken out on this home.
Original Mortgage
$113,500
Interest Rate
7.15%
Mortgage Type
Purchase Money Mortgage
Create a Home Valuation Report for This Property
The Home Valuation Report is an in-depth analysis detailing your home's value as well as a comparison with similar homes in the area
Home Values in the Area
Average Home Value in this Area
Purchase History
| Date | Buyer | Sale Price | Title Company |
|---|---|---|---|
| Heath Mark D | $168,500 | -- | |
| Fhlmc | $148,303 | -- | |
| Delisle Dominic | $119,500 | -- |
Source: Public Records
Mortgage History
| Date | Status | Borrower | Loan Amount |
|---|---|---|---|
| Open | Heath Mark D | $126,375 | |
| Previous Owner | Delisle Dominic | $66,750 | |
| Previous Owner | Delisle Dominic | $30,000 | |
| Previous Owner | Delisle Dominic | $120,600 | |
| Previous Owner | Delisle Dominic | $113,500 |
Source: Public Records
Tax History Compared to Growth
Tax History
| Year | Tax Paid | Tax Assessment Tax Assessment Total Assessment is a certain percentage of the fair market value that is determined by local assessors to be the total taxable value of land and additions on the property. | Land | Improvement |
|---|---|---|---|---|
| 2025 | $4,055 | $296,600 | $83,000 | $213,600 |
| 2024 | $3,911 | $288,400 | $80,600 | $207,800 |
| 2023 | $2,929 | $199,900 | $63,500 | $136,400 |
| 2022 | $3,304 | $199,900 | $63,500 | $136,400 |
| 2021 | $3,557 | $202,800 | $63,500 | $139,300 |
| 2020 | $3,550 | $199,900 | $63,500 | $136,400 |
| 2019 | $2,842 | $183,800 | $63,500 | $120,300 |
| 2018 | $2,792 | $174,500 | $60,000 | $114,500 |
| 2017 | $2,720 | $167,800 | $57,700 | $110,100 |
| 2016 | $2,616 | $167,800 | $57,700 | $110,100 |
| 2015 | $2,542 | $167,800 | $57,700 | $110,100 |
Source: Public Records
Map
Nearby Homes
- 2 Clinton St
- 12 Glen Cove Place Unit B
- 10 Glen Cove Place Unit A
- 108 Parsons St
- 98 Everett St
- 52-54 Everett St
- 33 Knipfer Ave
- 19 Nicols Way Unit 19
- 78 Holyoke St
- 52 Williston Ave
- 5 Lownds Ave
- 38 West St
- 125 Park St
- 33 Howard Ave
- 385 Main St
- M143 &152 Glendale St
- 41 South St Unit 11
- 2 Little St
- 6 S St & Abutting Lots
- 457 Northampton St
- 8 Princeton Ave
- 10 Princeton Ave
- 57 Parsons St
- 55 Parsons St Unit 3
- 55 Parsons St
- 49 Parsons St
- 37 Princeton Ave
- 59 Parsons St
- 11 Princeton Ave
- 43 Parsons St Unit 45
- 43 Parsons St Unit 1
- 43 Parsons St Unit 2
- 12 Princeton Ave
- 12 Princeton Ave Unit 2
- 6 Boylston St
- 56 Parsons St
- 8 Boylston St
- 60 Parsons St Unit 62
- 10 Boylston St
- 3-7 Princeton Ave