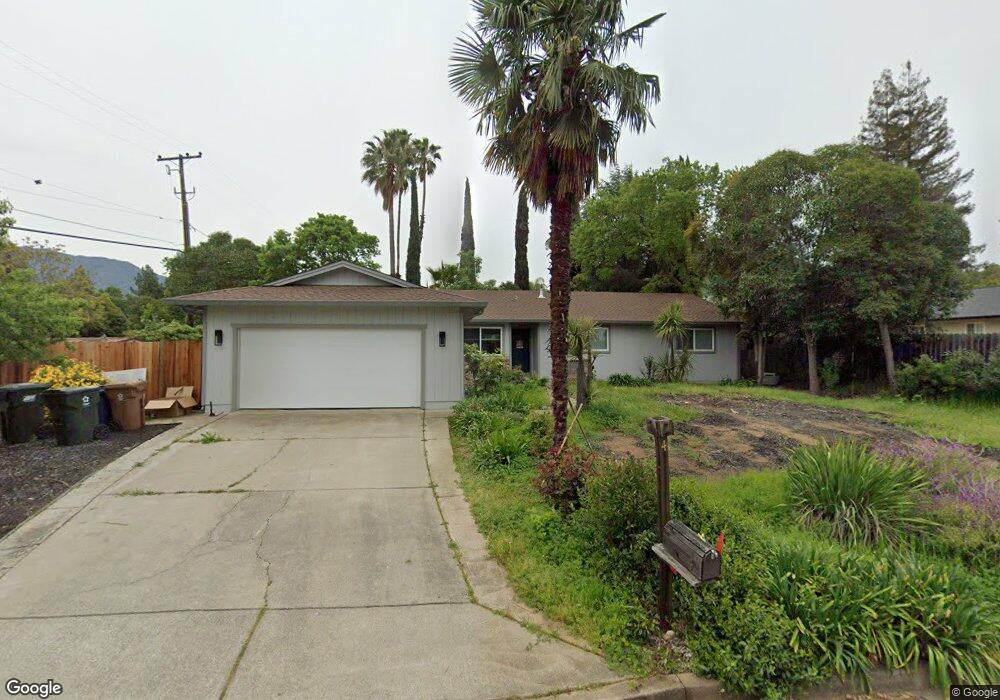
4 Rhine Ct Clayton, CA 94517
Estimated Value: $971,524 - $1,060,000
4
Beds
2
Baths
1,776
Sq Ft
$573/Sq Ft
Est. Value
About This Home
This home is located at 4 Rhine Ct, Clayton, CA 94517 and is currently estimated at $1,017,381, approximately $572 per square foot. 4 Rhine Ct is a home located in Contra Costa County with nearby schools including Mt. Diablo Elementary School, Diablo View Middle School, and College Park High School.
Ownership History
Date
Name
Owned For
Owner Type
Purchase Details
Closed on
Jan 12, 2018
Sold by
Prins Jiska Marit
Bought by
Loza David R
Current Estimated Value
Home Financials for this Owner
Home Financials are based on the most recent Mortgage that was taken out on this home.
Original Mortgage
$520,000
Outstanding Balance
$438,818
Interest Rate
3.94%
Mortgage Type
New Conventional
Estimated Equity
$578,563
Purchase Details
Closed on
Jan 10, 2018
Sold by
Noe Vorte Jacqueline Mona
Bought by
Loza David R
Home Financials for this Owner
Home Financials are based on the most recent Mortgage that was taken out on this home.
Original Mortgage
$520,000
Outstanding Balance
$438,818
Interest Rate
3.94%
Mortgage Type
New Conventional
Estimated Equity
$578,563
Purchase Details
Closed on
Apr 24, 2009
Sold by
Hayes Margaret Barbara Vodilla
Bought by
Noe Vorte Jacqueline Moira
Create a Home Valuation Report for This Property
The Home Valuation Report is an in-depth analysis detailing your home's value as well as a comparison with similar homes in the area
Home Values in the Area
Average Home Value in this Area
Purchase History
| Date | Buyer | Sale Price | Title Company |
|---|---|---|---|
| Loza David R | -- | Chicago Title Simplifile | |
| Loza David R | $650,000 | Chicago Title Simplifile | |
| Noe Vorte Jacqueline Moira | -- | None Available |
Source: Public Records
Mortgage History
| Date | Status | Borrower | Loan Amount |
|---|---|---|---|
| Open | Loza David R | $520,000 |
Source: Public Records
Tax History
| Year | Tax Paid | Tax Assessment Tax Assessment Total Assessment is a certain percentage of the fair market value that is determined by local assessors to be the total taxable value of land and additions on the property. | Land | Improvement |
|---|---|---|---|---|
| 2025 | $9,439 | $739,582 | $476,178 | $263,404 |
| 2024 | $9,032 | $725,082 | $466,842 | $258,240 |
| 2023 | $9,032 | $710,866 | $457,689 | $253,177 |
| 2022 | $8,911 | $696,928 | $448,715 | $248,213 |
| 2021 | $8,694 | $683,264 | $439,917 | $243,347 |
| 2019 | $8,525 | $663,000 | $426,870 | $236,130 |
| 2018 | $3,311 | $203,853 | $75,185 | $128,668 |
| 2017 | $3,190 | $199,857 | $73,711 | $126,146 |
| 2016 | $3,080 | $195,939 | $72,266 | $123,673 |
| 2015 | $3,016 | $192,997 | $71,181 | $121,816 |
| 2014 | $2,938 | $189,217 | $69,787 | $119,430 |
Source: Public Records
Map
Nearby Homes
- 5849 Mitchell Canyon Ct
- 5817 Mitchell Canyon Ct
- 1048 Panadero Ct
- 5795 Lewis Way
- 5 Pardi Ln
- 1000 Froyd Rd
- 1267 Quiet Cir
- 218 Mountaire Cir
- 249 Stranahan Cir
- 314 Semillon Cir
- 1421 Lydia Ln
- 5565 Jasper Ct
- 5565 Banff Ct
- 367 Mt Washington Way
- 1394 El Camino Dr
- 5535 Merritt Dr
- 5555 Maryland Dr
- 1346 Montana Dr
- 402 Chupcan Place
- 3 Rachel Ranch Ct
- 6 Goethals Ct
- 961 Mitchell Canyon Rd
- 1 Rhine Ct
- 8 Goethals Ct
- 6 Kenston Ct
- 5 Kenston Ct
- 911 Tiffin Dr
- 7 Rhine Ct
- 12 Goethals Ct
- 5843 Mitchell Canyon Ct
- 999 Mitchell Canyon Rd
- 2 Kenston Ct
- 10 Goethals Ct
- 5830 Del Trigo Ln
- 11 Rhine Ct
- 997 Kenston Dr
- 919 Tiffin Dr
- 5837 Mitchell Canyon Ct
- 985 Kenston Dr
- 5824 Del Trigo Ln
Your Personal Tour Guide
Ask me questions while you tour the home.