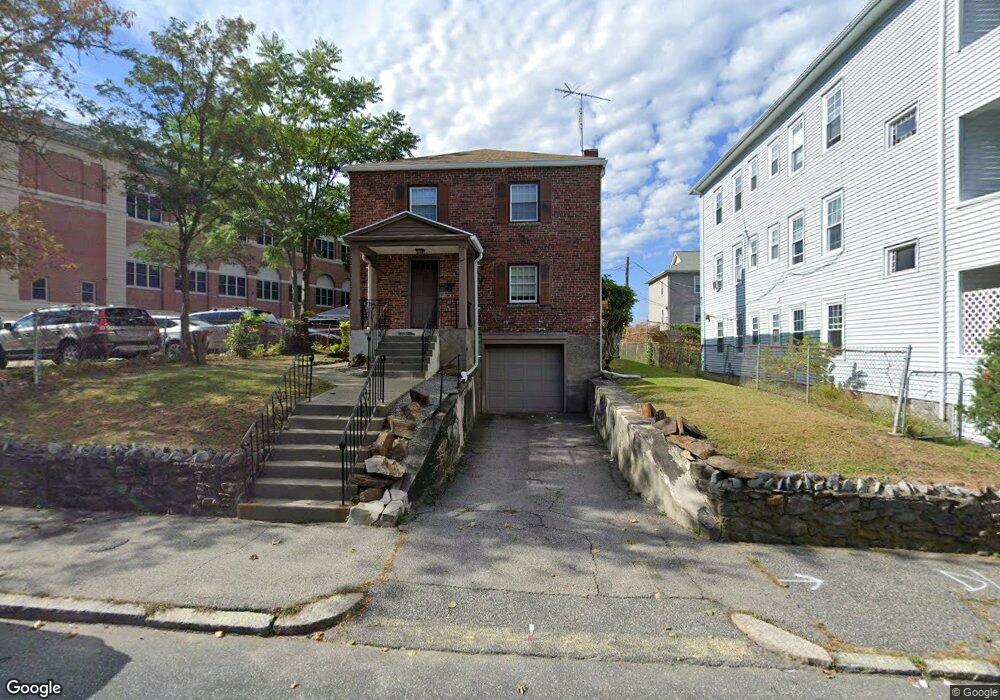
4 Richards St Worcester, MA 01603
University Park NeighborhoodEstimated Value: $371,000 - $400,058
3
Beds
2
Baths
1,609
Sq Ft
$237/Sq Ft
Est. Value
About This Home
This home is located at 4 Richards St, Worcester, MA 01603 and is currently estimated at $381,765, approximately $237 per square foot. 4 Richards St is a home located in Worcester County with nearby schools including Goddard School of Science & Technology, Jacob Hiatt Magnet School, and Chandler Magnet.
Ownership History
Date
Name
Owned For
Owner Type
Purchase Details
Closed on
Jun 2, 2009
Sold by
Valinski Beverly
Bought by
Alvarez Marlene C
Current Estimated Value
Home Financials for this Owner
Home Financials are based on the most recent Mortgage that was taken out on this home.
Original Mortgage
$146,520
Outstanding Balance
$91,473
Interest Rate
4.87%
Mortgage Type
Purchase Money Mortgage
Estimated Equity
$290,292
Create a Home Valuation Report for This Property
The Home Valuation Report is an in-depth analysis detailing your home's value as well as a comparison with similar homes in the area
Home Values in the Area
Average Home Value in this Area
Purchase History
| Date | Buyer | Sale Price | Title Company |
|---|---|---|---|
| Alvarez Marlene C | $160,000 | -- |
Source: Public Records
Mortgage History
| Date | Status | Borrower | Loan Amount |
|---|---|---|---|
| Open | Alvarez Marlene C | $146,520 |
Source: Public Records
Tax History
| Year | Tax Paid | Tax Assessment Tax Assessment Total Assessment is a certain percentage of the fair market value that is determined by local assessors to be the total taxable value of land and additions on the property. | Land | Improvement |
|---|---|---|---|---|
| 2025 | $4,416 | $334,800 | $81,200 | $253,600 |
| 2024 | $4,309 | $313,400 | $81,200 | $232,200 |
| 2023 | $4,151 | $289,500 | $70,600 | $218,900 |
| 2022 | $3,844 | $252,700 | $56,500 | $196,200 |
| 2021 | $3,731 | $229,200 | $45,200 | $184,000 |
| 2020 | $3,597 | $211,600 | $44,900 | $166,700 |
| 2019 | $3,442 | $191,200 | $39,200 | $152,000 |
| 2018 | $3,408 | $180,200 | $39,200 | $141,000 |
| 2017 | $3,265 | $169,900 | $39,200 | $130,700 |
| 2016 | $3,271 | $158,700 | $28,300 | $130,400 |
| 2015 | $3,185 | $158,700 | $28,300 | $130,400 |
| 2014 | $3,101 | $158,700 | $28,300 | $130,400 |
Source: Public Records
Map
Nearby Homes
Your Personal Tour Guide
Ask me questions while you tour the home.