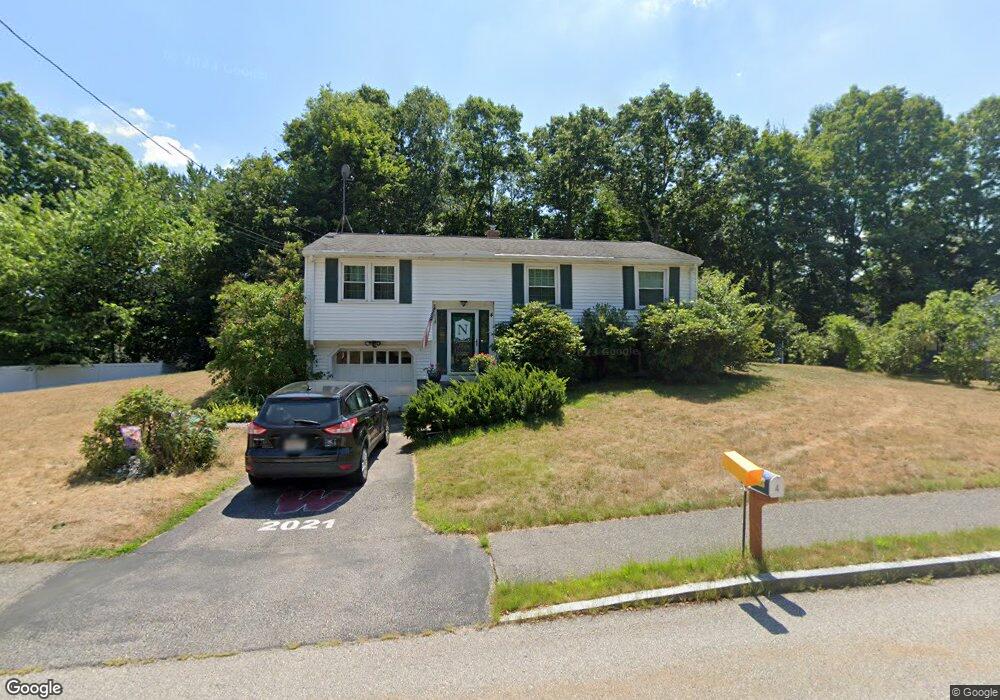
4 Robin Ln Westborough, MA 01581
Estimated Value: $558,487 - $617,000
3
Beds
2
Baths
951
Sq Ft
$615/Sq Ft
Est. Value
About This Home
This home is located at 4 Robin Ln, Westborough, MA 01581 and is currently estimated at $584,872, approximately $615 per square foot. 4 Robin Ln is a home located in Worcester County with nearby schools including Westborough High School, Ebridge Montessori School, and Westboro Knowledge Beginnings.
Ownership History
Date
Name
Owned For
Owner Type
Purchase Details
Closed on
Jun 28, 1996
Sold by
Jones Hawley and Jones Sandra
Bought by
Franciose Paul R
Current Estimated Value
Home Financials for this Owner
Home Financials are based on the most recent Mortgage that was taken out on this home.
Original Mortgage
$69,000
Outstanding Balance
$4,904
Interest Rate
8.05%
Mortgage Type
Purchase Money Mortgage
Estimated Equity
$579,968
Create a Home Valuation Report for This Property
The Home Valuation Report is an in-depth analysis detailing your home's value as well as a comparison with similar homes in the area
Home Values in the Area
Average Home Value in this Area
Purchase History
| Date | Buyer | Sale Price | Title Company |
|---|---|---|---|
| Franciose Paul R | $149,000 | -- |
Source: Public Records
Mortgage History
| Date | Status | Borrower | Loan Amount |
|---|---|---|---|
| Open | Franciose Paul R | $69,000 | |
| Previous Owner | Franciose Paul R | $25,000 | |
| Previous Owner | Franciose Paul R | $42,000 | |
| Previous Owner | Franciose Paul R | $86,000 |
Source: Public Records
Tax History
| Year | Tax Paid | Tax Assessment Tax Assessment Total Assessment is a certain percentage of the fair market value that is determined by local assessors to be the total taxable value of land and additions on the property. | Land | Improvement |
|---|---|---|---|---|
| 2025 | $8,438 | $518,000 | $315,600 | $202,400 |
| 2024 | $7,690 | $468,600 | $280,500 | $188,100 |
| 2023 | $7,368 | $437,500 | $264,600 | $172,900 |
| 2022 | $7,069 | $382,300 | $223,800 | $158,500 |
| 2021 | $6,906 | $372,500 | $214,000 | $158,500 |
| 2020 | $6,370 | $347,700 | $196,500 | $151,200 |
| 2019 | $6,097 | $332,600 | $198,400 | $134,200 |
| 2018 | $5,654 | $306,300 | $190,700 | $115,600 |
| 2017 | $5,459 | $306,700 | $190,700 | $116,000 |
| 2016 | $5,025 | $282,800 | $175,100 | $107,700 |
| 2015 | $4,701 | $252,900 | $155,600 | $97,300 |
Source: Public Records
Map
Nearby Homes
- 19 Treetop Park Unit 19
- 5 Wessonville Village Way Unit 5
- 4203 Peters Farm Way Unit 4203
- 22 Park St
- 196 -198 Turnpike Rd
- 18 Fairview Rd
- 155 Milk St Unit 27
- 155 Milk St Unit 5
- 23 Water St
- 165 Turnpike Rd Unit 7
- 44 South St
- 37 Oneil Dr
- 34 Harvey Ln
- 2306 Talbot Way Unit 2306
- 26 Mount Pleasant St
- 192 W Main St
- 5 Peters Farm Way Unit 209
- 5 Peters Farm Way Unit 111
- 5 Peters Farm Way Unit 206
- 5 Peters Farm Way Unit 107
Your Personal Tour Guide
Ask me questions while you tour the home.