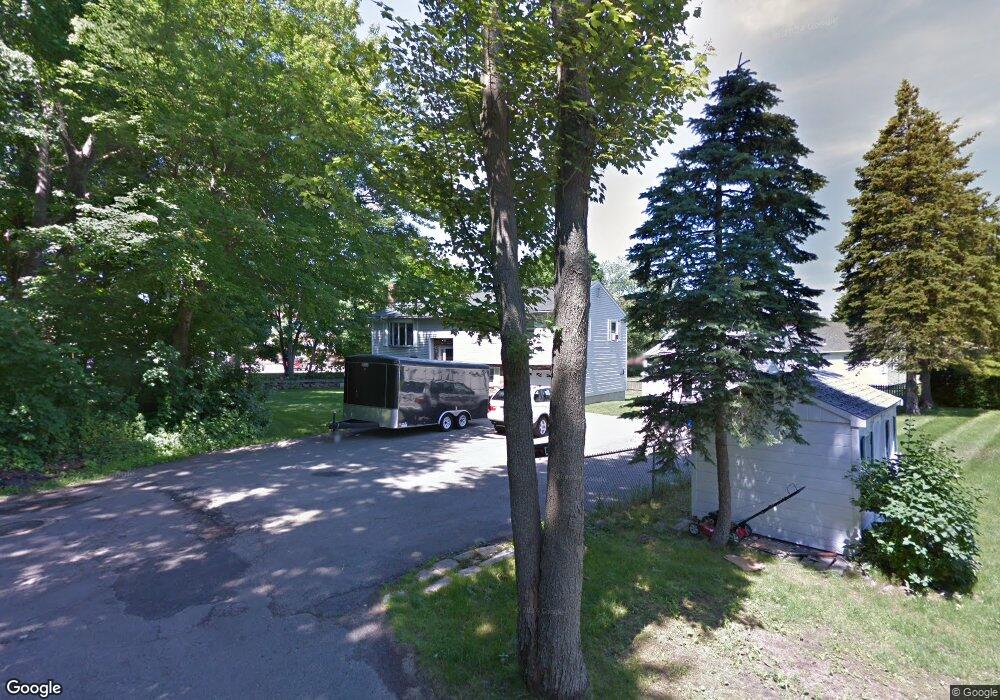
4 Rushton St Methuen, MA 01844
Downtown Methuen NeighborhoodEstimated Value: $559,000 - $612,000
3
Beds
2
Baths
1,614
Sq Ft
$363/Sq Ft
Est. Value
About This Home
This home is located at 4 Rushton St, Methuen, MA 01844 and is currently estimated at $586,626, approximately $363 per square foot. 4 Rushton St is a home located in Essex County with nearby schools including Tenney Grammar School, Methuen High School, and Saint Monica School.
Ownership History
Date
Name
Owned For
Owner Type
Purchase Details
Closed on
Feb 6, 2009
Sold by
Carpenito Larry
Bought by
Carpenito Larry and Carpenito Kimberly
Current Estimated Value
Home Financials for this Owner
Home Financials are based on the most recent Mortgage that was taken out on this home.
Original Mortgage
$281,847
Outstanding Balance
$178,341
Interest Rate
5.2%
Mortgage Type
FHA
Estimated Equity
$408,285
Purchase Details
Closed on
Apr 20, 1999
Sold by
Marmolejos Ruben
Bought by
Carpenito Larry
Purchase Details
Closed on
Apr 14, 1995
Sold by
Stanca Constantin V
Bought by
Hajjar Kenneth J
Purchase Details
Closed on
Oct 27, 1989
Sold by
Whittaker Michael
Bought by
Stanca Constantin
Create a Home Valuation Report for This Property
The Home Valuation Report is an in-depth analysis detailing your home's value as well as a comparison with similar homes in the area
Home Values in the Area
Average Home Value in this Area
Purchase History
| Date | Buyer | Sale Price | Title Company |
|---|---|---|---|
| Carpenito Larry | -- | -- | |
| Carpenito Larry | -- | -- | |
| Carpenito Larry | -- | -- | |
| Carpenito Larry | $150,000 | -- | |
| Carpenito Larry | $150,000 | -- | |
| Hajjar Kenneth J | $110,000 | -- | |
| Hajjar Kenneth J | $110,000 | -- | |
| Stanca Constantin | $140,000 | -- |
Source: Public Records
Mortgage History
| Date | Status | Borrower | Loan Amount |
|---|---|---|---|
| Open | Carpenito Larry | $281,847 | |
| Closed | Stanca Constantin | $281,847 |
Source: Public Records
Tax History
| Year | Tax Paid | Tax Assessment Tax Assessment Total Assessment is a certain percentage of the fair market value that is determined by local assessors to be the total taxable value of land and additions on the property. | Land | Improvement |
|---|---|---|---|---|
| 2025 | $5,462 | $516,300 | $214,300 | $302,000 |
| 2024 | $5,510 | $507,400 | $195,500 | $311,900 |
| 2023 | $5,216 | $445,800 | $173,700 | $272,100 |
| 2022 | $4,836 | $370,600 | $144,800 | $225,800 |
| 2021 | $4,587 | $347,800 | $137,500 | $210,300 |
| 2020 | $4,549 | $338,500 | $137,500 | $201,000 |
| 2019 | $4,356 | $307,000 | $123,100 | $183,900 |
| 2018 | $4,198 | $294,200 | $123,100 | $171,100 |
| 2017 | $4,029 | $275,000 | $123,100 | $151,900 |
| 2016 | $3,870 | $261,300 | $115,800 | $145,500 |
| 2015 | $3,768 | $258,100 | $115,800 | $142,300 |
Source: Public Records
Map
Nearby Homes
- 123 Lawrence St
- 97 Kenwood Rd
- 82 Oakside Ave
- 687 Jackson St
- 611 Prospect St
- 593 Prospect St
- 173 Jackson St
- 9-11 Horne St
- Lot 108 Garden City Rd
- 29 Center St
- 37 Albion St
- 24 Railroad St
- 64-66 Howe St
- 8 Ridgeview Ave
- 23 Chase St
- 25-27 Bicknell Ave
- 25 Carol Ave
- 7-9 Carleton Ct
- 129-131 Lexington St
- 20-22 Ashland Ave
- 3 Dow St
- 28 Pleasant View St
- 20 Pleasant View St
- 38 Pleasant View St
- 40 Pleasant View St
- Lot A Pleasant View St
- 16 Pleasant View St
- 4 Dow St
- 33 Pleasant View St
- 25 Pleasant View St
- 82 Davis Rd
- 80 Davis Rd
- 86 Davis Rd
- 6 Pleasant View St
- 37 Pleasant View St
- 10 Rushton St
- 9 Pleasant View St
- 39 Pleasant View St
- 15 Pleasant View St
- 83 Davis Rd
Your Personal Tour Guide
Ask me questions while you tour the home.