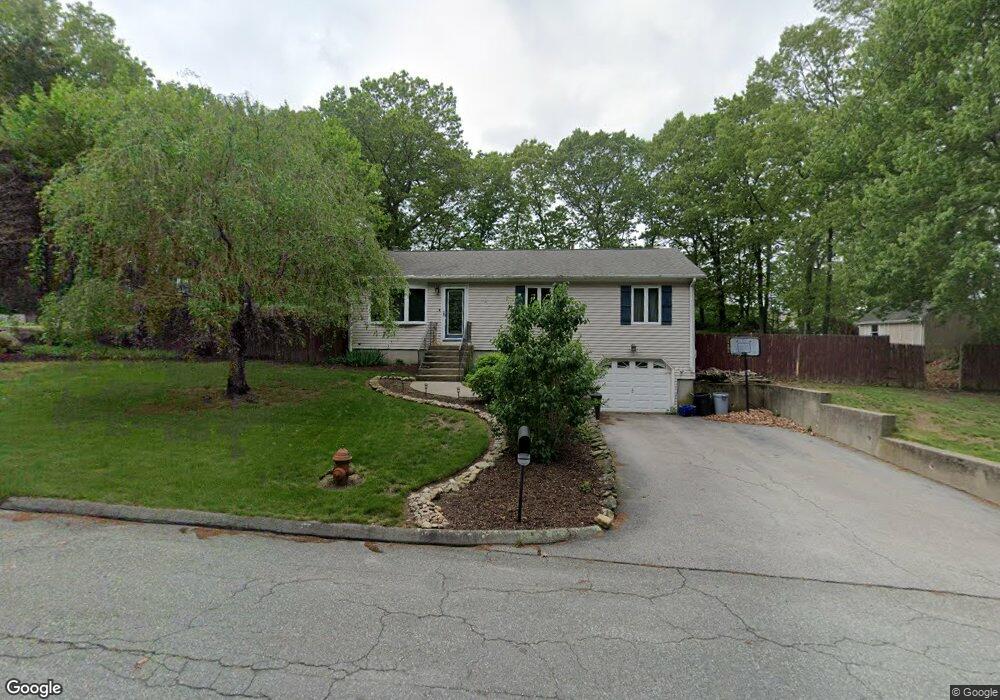
4 Shari Dr Johnston, RI 02919
Thornton NeighborhoodEstimated Value: $446,142 - $529,000
3
Beds
1
Bath
1,560
Sq Ft
$315/Sq Ft
Est. Value
About This Home
This home is located at 4 Shari Dr, Johnston, RI 02919 and is currently estimated at $491,286, approximately $314 per square foot. 4 Shari Dr is a home located in Providence County with nearby schools including Mazomanie Elementary School, Johnston Senior High School, and St Rocco School.
Ownership History
Date
Name
Owned For
Owner Type
Purchase Details
Closed on
Aug 18, 2015
Sold by
Pinto Stephanie M
Bought by
Charpentier Gerard N and Charpentier Cerbo-Charpentier K
Current Estimated Value
Home Financials for this Owner
Home Financials are based on the most recent Mortgage that was taken out on this home.
Original Mortgage
$196,377
Outstanding Balance
$154,711
Interest Rate
4.08%
Mortgage Type
FHA
Estimated Equity
$336,575
Purchase Details
Closed on
Oct 7, 2003
Sold by
Kessinger Keith A and Kessinger Joanne L
Bought by
Rogers Kenneth A and Rogers Stephanie M
Purchase Details
Closed on
Sep 25, 2001
Sold by
Boyer Cheryl R
Bought by
Kessinger Keith A and Kessinger Joanne L
Create a Home Valuation Report for This Property
The Home Valuation Report is an in-depth analysis detailing your home's value as well as a comparison with similar homes in the area
Home Values in the Area
Average Home Value in this Area
Purchase History
| Date | Buyer | Sale Price | Title Company |
|---|---|---|---|
| Charpentier Gerard N | $200,000 | -- | |
| Rogers Kenneth A | $200,000 | -- | |
| Kessinger Keith A | $155,000 | -- | |
| Charpentier Gerard N | $200,000 | -- | |
| Rogers Kenneth A | $200,000 | -- | |
| Kessinger Keith A | $155,000 | -- |
Source: Public Records
Mortgage History
| Date | Status | Borrower | Loan Amount |
|---|---|---|---|
| Open | Kessinger Keith A | $196,377 | |
| Closed | Kessinger Keith A | $196,377 | |
| Previous Owner | Kessinger Keith A | $205,000 |
Source: Public Records
Tax History Compared to Growth
Tax History
| Year | Tax Paid | Tax Assessment Tax Assessment Total Assessment is a certain percentage of the fair market value that is determined by local assessors to be the total taxable value of land and additions on the property. | Land | Improvement |
|---|---|---|---|---|
| 2025 | $5,400 | $345,700 | $105,200 | $240,500 |
| 2024 | $5,289 | $345,700 | $105,200 | $240,500 |
| 2023 | $5,289 | $345,700 | $105,200 | $240,500 |
| 2022 | $4,140 | $222,700 | $80,800 | $141,900 |
| 2021 | $5,176 | $222,700 | $80,800 | $141,900 |
| 2018 | $4,923 | $179,100 | $63,500 | $115,600 |
| 2016 | $6,514 | $179,100 | $63,500 | $115,600 |
| 2015 | $5,143 | $177,400 | $66,400 | $111,000 |
| 2014 | $5,100 | $177,400 | $66,400 | $111,000 |
| 2013 | $5,100 | $177,400 | $66,400 | $111,000 |
Source: Public Records
Map
Nearby Homes
- 2 Robert Cir
- 27 Tartaglia St
- 12 Alvina Dr
- 27 Nardolillo St
- 250 Fountain Ave
- 1603 Plainfield Pike Unit D5
- 1603 Plainfield Pike Unit E2
- 118 Westfield Dr
- 26 Rachela St
- 142 Scituate Ave
- 17 Woodview Dr
- 53 Charcalee Dr
- 1 Pico Cir
- 7 Pico Cir
- 5 Pico Cir
- 6 Pico Cir
- 7 Taylor Rd
- 11 Red Robin Rd
- 38 Mill St
- 16 Shaw Ave