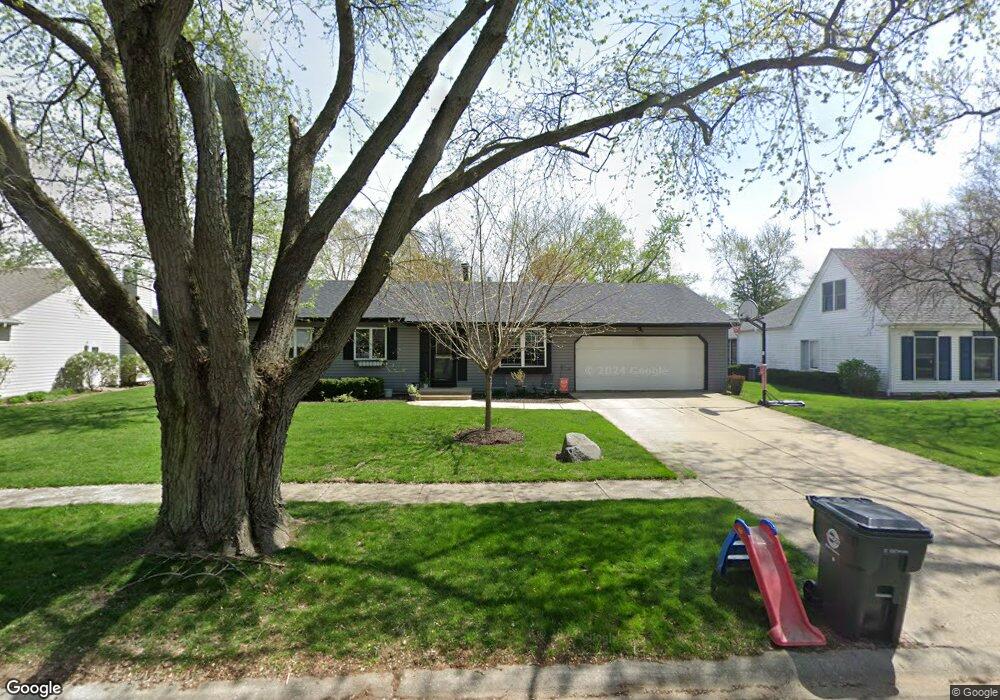
4 Sherwick Rd Oswego, IL 60543
Boulder Hill NeighborhoodEstimated Value: $309,000 - $328,000
3
Beds
2
Baths
1,280
Sq Ft
$248/Sq Ft
Est. Value
About This Home
This home is located at 4 Sherwick Rd, Oswego, IL 60543 and is currently estimated at $317,860, approximately $248 per square foot. 4 Sherwick Rd is a home located in Kendall County with nearby schools including Old Post Elementary School, Thompson Jr. High School, and Oswego High School.
Ownership History
Date
Name
Owned For
Owner Type
Purchase Details
Closed on
Jun 2, 2006
Sold by
Abel Jeremy M and Abel Danielle L
Bought by
Nervis Justin J and Davila Deborah A
Current Estimated Value
Home Financials for this Owner
Home Financials are based on the most recent Mortgage that was taken out on this home.
Original Mortgage
$223,147
Outstanding Balance
$132,290
Interest Rate
6.72%
Mortgage Type
FHA
Estimated Equity
$185,570
Purchase Details
Closed on
Mar 30, 2004
Sold by
Close Kenneth and Close Janette
Bought by
Abel Jeremy M and Abel Danielle L
Home Financials for this Owner
Home Financials are based on the most recent Mortgage that was taken out on this home.
Original Mortgage
$167,627
Interest Rate
5.46%
Mortgage Type
FHA
Purchase Details
Closed on
Jun 6, 2003
Sold by
Loomis Valerie
Bought by
Close Kenneth and Close Janette
Home Financials for this Owner
Home Financials are based on the most recent Mortgage that was taken out on this home.
Original Mortgage
$132,000
Interest Rate
5.74%
Mortgage Type
Purchase Money Mortgage
Purchase Details
Closed on
Apr 1, 1993
Bought by
Loomis Valerie
Create a Home Valuation Report for This Property
The Home Valuation Report is an in-depth analysis detailing your home's value as well as a comparison with similar homes in the area
Home Values in the Area
Average Home Value in this Area
Purchase History
| Date | Buyer | Sale Price | Title Company |
|---|---|---|---|
| Nervis Justin J | $226,500 | Multiple | |
| Abel Jeremy M | $170,000 | First American Title | |
| Close Kenneth | $165,000 | First American Title | |
| Loomis Valerie | $123,000 | -- |
Source: Public Records
Mortgage History
| Date | Status | Borrower | Loan Amount |
|---|---|---|---|
| Open | Nervis Justin J | $223,147 | |
| Previous Owner | Abel Jeremy M | $167,627 | |
| Previous Owner | Close Kenneth | $132,000 | |
| Closed | Loomis Valerie | -- |
Source: Public Records
Tax History
| Year | Tax Paid | Tax Assessment Tax Assessment Total Assessment is a certain percentage of the fair market value that is determined by local assessors to be the total taxable value of land and additions on the property. | Land | Improvement |
|---|---|---|---|---|
| 2024 | $6,109 | $81,915 | $21,511 | $60,404 |
| 2023 | $6,170 | $79,529 | $20,884 | $58,645 |
| 2022 | $6,170 | $74,326 | $19,518 | $54,808 |
| 2021 | $5,938 | $69,463 | $18,241 | $51,222 |
| 2020 | $5,744 | $66,791 | $17,539 | $49,252 |
| 2019 | $5,835 | $66,791 | $17,539 | $49,252 |
| 2018 | $5,318 | $60,946 | $16,004 | $44,942 |
| 2017 | $5,143 | $56,171 | $14,750 | $41,421 |
| 2016 | $4,736 | $51,533 | $13,532 | $38,001 |
| 2015 | $4,551 | $47,716 | $12,530 | $35,186 |
| 2014 | -- | $45,881 | $12,048 | $33,833 |
| 2013 | -- | $48,296 | $12,682 | $35,614 |
Source: Public Records
Map
Nearby Homes
- 9 Cebold Dr
- 521 Waterford Dr
- 135 Chesterfield Dr
- 22 Guilford Rd
- 510 Waterford Dr
- 1300 Orchard Rd
- 3 Orchard Rd
- 123 Orchard Rd
- 2 Orchard Rd
- 109 Old Post Rd
- 86 Circle Dr E
- 28 Seneca Dr
- 20 Durango Rd
- 133 River Mist Dr Unit 3
- 116 River Mist Dr
- 135 River Mist Dr Unit 2
- 397 Cascade Ln Unit 2
- 119 Garden Dr
- 117 Boulder Hill Pass Unit 117
- 1415 State Route 31
- 6 Sherwick Rd
- 2 Sherwick Rd
- 32 Brock Way
- 32 Brockway Dr
- 46 Sedgwick Rd
- 44 Sedgwick Rd
- 8 Sherwick Rd Unit 30
- 42 Sedgwick Rd
- 48 Sedgwick Rd
- 40 Brock Way
- 5 Sherwick Rd Unit 30
- 10 Sherwick Rd
- 40 Sedgwick Rd
- 7 Sherwick Rd
- 42 Brock Way
- 9 Sherwick Rd Unit 30
- 3 Yeadon Dr
- 38 Sedgwick Rd
- 12 Sherwick Rd
- 4 Yeadon Dr
Your Personal Tour Guide
Ask me questions while you tour the home.