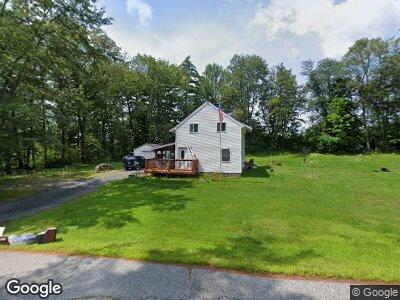
4 Springfield Rd Newport, NH 03773
Estimated Value: $360,000 - $419,000
3
Beds
3
Baths
1,853
Sq Ft
$211/Sq Ft
Est. Value
About This Home
This home is located at 4 Springfield Rd, Newport, NH 03773 and is currently estimated at $390,142, approximately $210 per square foot. 4 Springfield Rd is a home located in Sullivan County with nearby schools including Richards Elementary School, Newport High School, and Newport Montessori School.
Ownership History
Date
Name
Owned For
Owner Type
Purchase Details
Closed on
Nov 16, 2020
Sold by
Bangrazi James F
Bought by
Dougherty James F
Current Estimated Value
Home Financials for this Owner
Home Financials are based on the most recent Mortgage that was taken out on this home.
Original Mortgage
$207,000
Outstanding Balance
$186,705
Interest Rate
2.8%
Mortgage Type
New Conventional
Estimated Equity
$203,437
Purchase Details
Closed on
Aug 16, 2016
Sold by
Arlp Reco 4 Llc
Bought by
Bangrazi James F
Purchase Details
Closed on
Jul 2, 2015
Sold by
Baker Eleanor R
Bought by
Wilmington Svgs Fund S
Purchase Details
Closed on
Jul 15, 1996
Sold by
Connor Verna C
Bought by
Baker Edward O and Baker Eleanor R
Home Financials for this Owner
Home Financials are based on the most recent Mortgage that was taken out on this home.
Original Mortgage
$59,867
Interest Rate
7.98%
Create a Home Valuation Report for This Property
The Home Valuation Report is an in-depth analysis detailing your home's value as well as a comparison with similar homes in the area
Home Values in the Area
Average Home Value in this Area
Purchase History
| Date | Buyer | Sale Price | Title Company |
|---|---|---|---|
| Dougherty James F | $230,000 | None Available | |
| Bangrazi James F | $31,666 | -- | |
| Wilmington Svgs Fund S | $170,000 | -- | |
| Baker Edward O | $59,900 | -- |
Source: Public Records
Mortgage History
| Date | Status | Borrower | Loan Amount |
|---|---|---|---|
| Open | Dougherty James F | $207,000 | |
| Previous Owner | Baker Eleanor R | $134,200 | |
| Previous Owner | Baker Edward O | $59,867 |
Source: Public Records
Tax History Compared to Growth
Tax History
| Year | Tax Paid | Tax Assessment Tax Assessment Total Assessment is a certain percentage of the fair market value that is determined by local assessors to be the total taxable value of land and additions on the property. | Land | Improvement |
|---|---|---|---|---|
| 2024 | $7,142 | $293,800 | $72,300 | $221,500 |
| 2023 | $6,928 | $293,800 | $72,300 | $221,500 |
| 2022 | $6,140 | $293,800 | $72,300 | $221,500 |
| 2021 | $5,488 | $166,300 | $52,400 | $113,900 |
| 2020 | $4,687 | $141,600 | $52,400 | $89,200 |
| 2019 | $4,564 | $140,300 | $52,400 | $87,900 |
| 2018 | $2,599 | $85,500 | $52,400 | $33,100 |
| 2017 | $2,535 | $84,400 | $52,400 | $32,000 |
| 2016 | $2,968 | $103,300 | $47,500 | $55,800 |
| 2015 | $3,022 | $103,300 | $47,500 | $55,800 |
| 2014 | $3,268 | $103,300 | $47,500 | $55,800 |
| 2013 | $3,098 | $103,300 | $47,500 | $55,800 |
Source: Public Records
Map
Nearby Homes
- 0 Route 11 Unit 5024851
- 428 Maple St
- 503 Bradford Rd
- 22 Pine Ridge Rd
- 31 Sunshine Ave
- 66 Sunshine Ave
- 21 Beech St
- 11 Linden Ave
- 0 Reeds Mill Rd
- 41 Prospect St
- 19 Highland Ave
- 49 Park St
- 92 S Main St
- 14 Sugarhouse Ln
- 0 New Hampshire 10
- 00 N Main St
- 72 Marys Rd
- 0 Belknap Ave
- Lot 1 Nutting Rd
- 17 Kyle Dr Unit 17
- 4 Springfield Rd
- 4 Springfield Rd
- 560 Sunapee St
- 00 Springfield Rd
- 12 Springfield Rd
- 16 Springfield Rd
- LOT 16 & LOT 17 Springfield Rd Unit 16 & 17
- 559 Sunapee St Unit 8000
- 20 Springfield Rd
- 5 Paradise Rd
- 24 Springfield Rd
- 3 Paradise Rd
- 27 Springfield Rd
- 27 Springfield Rd
- 1 Paradise Rd
- Lot #16 Springfield Rd
- 535 Sunapee St
- 11 Paradise Rd
- 530 Sunapee St
- 35 Springfield Rd