4 Stemson Way Savannah, GA 31407
Estimated Value: $257,000 - $268,096
3
Beds
2
Baths
1,358
Sq Ft
$193/Sq Ft
Est. Value
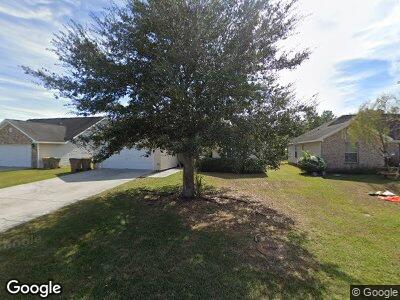
About This Home
This home is located at 4 Stemson Way, Savannah, GA 31407 and is currently estimated at $262,024, approximately $192 per square foot. 4 Stemson Way is a home located in Chatham County with nearby schools including Rice Creek K-8 School and Groves High School.
Ownership History
Date
Name
Owned For
Owner Type
Purchase Details
Closed on
Mar 30, 2010
Sold by
Lanier Renaissance Inc
Bought by
Brisbon Patricia Ann
Current Estimated Value
Home Financials for this Owner
Home Financials are based on the most recent Mortgage that was taken out on this home.
Original Mortgage
$112,244
Outstanding Balance
$76,086
Interest Rate
4.97%
Mortgage Type
New Conventional
Estimated Equity
$185,938
Purchase Details
Closed on
Dec 1, 2009
Sold by
Bachard Inc
Bought by
Lanier Renaissance Inc
Purchase Details
Closed on
Oct 27, 2006
Sold by
Not Provided
Bought by
Brisbon Patricia Ann
Home Financials for this Owner
Home Financials are based on the most recent Mortgage that was taken out on this home.
Original Mortgage
$130,150
Interest Rate
6.25%
Mortgage Type
New Conventional
Create a Home Valuation Report for This Property
The Home Valuation Report is an in-depth analysis detailing your home's value as well as a comparison with similar homes in the area
Home Values in the Area
Average Home Value in this Area
Purchase History
| Date | Buyer | Sale Price | Title Company |
|---|---|---|---|
| Brisbon Patricia Ann | $110,000 | -- | |
| Lanier Renaissance Inc | -- | -- | |
| Bachard Inc | $50,800 | -- | |
| Brisbon Patricia Ann | $137,000 | -- |
Source: Public Records
Mortgage History
| Date | Status | Borrower | Loan Amount |
|---|---|---|---|
| Open | Brisbon Patricia Ann | $112,244 | |
| Previous Owner | Brisbon Patricia Ann | $130,150 | |
| Previous Owner | Fong Marie Michelle | $99,880 |
Source: Public Records
Tax History Compared to Growth
Tax History
| Year | Tax Paid | Tax Assessment Tax Assessment Total Assessment is a certain percentage of the fair market value that is determined by local assessors to be the total taxable value of land and additions on the property. | Land | Improvement |
|---|---|---|---|---|
| 2024 | $1,462 | $89,320 | $18,000 | $71,320 |
| 2023 | $854 | $83,480 | $18,000 | $65,480 |
| 2022 | $1,331 | $67,040 | $8,000 | $59,040 |
| 2021 | $1,319 | $58,320 | $8,000 | $50,320 |
| 2020 | $1,333 | $56,840 | $8,000 | $48,840 |
| 2019 | $1,333 | $49,560 | $8,000 | $41,560 |
| 2018 | $1,496 | $47,960 | $8,000 | $39,960 |
| 2017 | $1,398 | $48,280 | $8,000 | $40,280 |
| 2016 | $1,174 | $41,440 | $8,000 | $33,440 |
| 2015 | $1,189 | $41,840 | $8,000 | $33,840 |
| 2014 | $1,600 | $38,560 | $0 | $0 |
Source: Public Records
Map
Nearby Homes