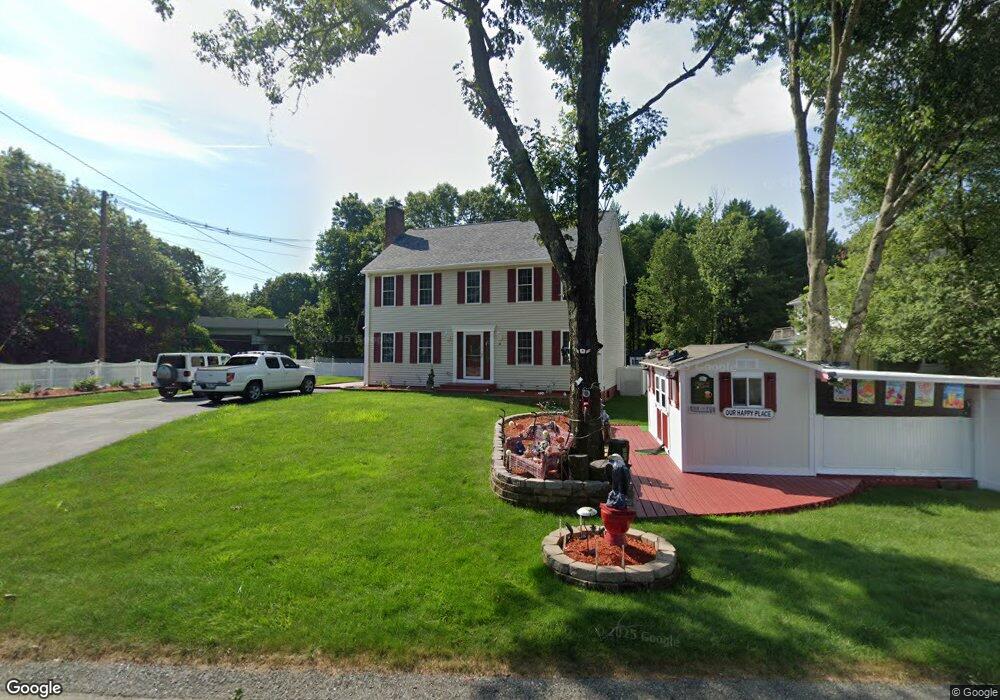
4 Tanya Dr Attleboro, MA 02703
Estimated Value: $592,203 - $792,000
4
Beds
3
Baths
1,900
Sq Ft
$355/Sq Ft
Est. Value
About This Home
This home is located at 4 Tanya Dr, Attleboro, MA 02703 and is currently estimated at $673,551, approximately $354 per square foot. 4 Tanya Dr is a home located in Bristol County with nearby schools including Hill-Roberts Elementary School, Robert J. Coelho Middle School, and Attleboro High School.
Ownership History
Date
Name
Owned For
Owner Type
Purchase Details
Closed on
Nov 24, 1999
Sold by
R B Concrete Forms Inc
Bought by
Kefel Sami M and Kefel Samira Z
Current Estimated Value
Home Financials for this Owner
Home Financials are based on the most recent Mortgage that was taken out on this home.
Original Mortgage
$187,441
Outstanding Balance
$57,311
Interest Rate
7.77%
Mortgage Type
Purchase Money Mortgage
Estimated Equity
$616,240
Create a Home Valuation Report for This Property
The Home Valuation Report is an in-depth analysis detailing your home's value as well as a comparison with similar homes in the area
Home Values in the Area
Average Home Value in this Area
Purchase History
| Date | Buyer | Sale Price | Title Company |
|---|---|---|---|
| Kefel Sami M | $208,500 | -- |
Source: Public Records
Mortgage History
| Date | Status | Borrower | Loan Amount |
|---|---|---|---|
| Open | Kefel Sami M | $58,300 | |
| Open | Kefel Sami M | $187,441 |
Source: Public Records
Tax History Compared to Growth
Tax History
| Year | Tax Paid | Tax Assessment Tax Assessment Total Assessment is a certain percentage of the fair market value that is determined by local assessors to be the total taxable value of land and additions on the property. | Land | Improvement |
|---|---|---|---|---|
| 2025 | $5,995 | $477,700 | $167,300 | $310,400 |
| 2024 | $5,653 | $444,100 | $150,600 | $293,500 |
| 2023 | $5,369 | $392,200 | $152,100 | $240,100 |
| 2022 | $5,162 | $357,200 | $144,900 | $212,300 |
| 2021 | $6,867 | $347,200 | $139,400 | $207,800 |
| 2020 | $4,899 | $336,500 | $133,400 | $203,100 |
| 2019 | $4,765 | $336,500 | $130,800 | $205,700 |
| 2018 | $4,386 | $312,300 | $127,000 | $185,300 |
| 2017 | $4,243 | $309,500 | $123,700 | $185,800 |
| 2016 | $4,356 | $293,900 | $115,600 | $178,300 |
| 2015 | $4,238 | $288,100 | $115,600 | $172,500 |
| 2014 | $4,176 | $281,200 | $110,600 | $170,600 |
Source: Public Records
Map
Nearby Homes