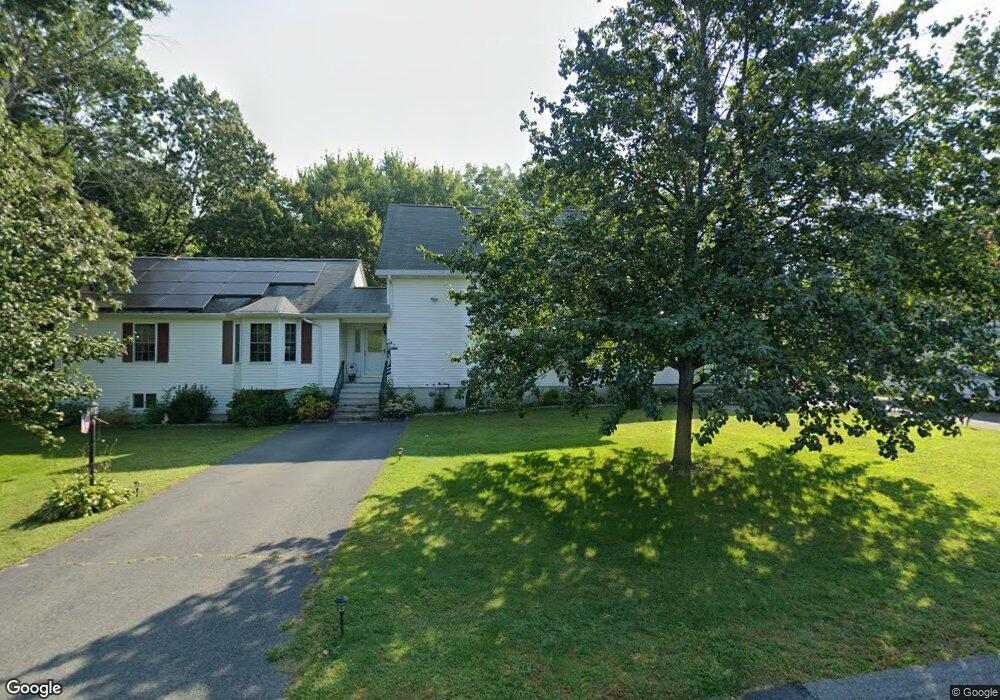
4 Thayer Rd Bellingham, MA 02019
Estimated Value: $586,700 - $791,000
5
Beds
2
Baths
2,222
Sq Ft
$303/Sq Ft
Est. Value
About This Home
This home is located at 4 Thayer Rd, Bellingham, MA 02019 and is currently estimated at $673,675, approximately $303 per square foot. 4 Thayer Rd is a home located in Norfolk County with nearby schools including Stall Brook Elementary School, Bellingham High School, and Bethany Christian Academy.
Ownership History
Date
Name
Owned For
Owner Type
Purchase Details
Closed on
Nov 6, 2017
Sold by
Mcinnis Geraldine C
Bought by
Tofani James J and Tofani Josephine R
Current Estimated Value
Purchase Details
Closed on
Jul 28, 2008
Sold by
Pembroke Rt
Bought by
Mcinnis Geraldine C
Home Financials for this Owner
Home Financials are based on the most recent Mortgage that was taken out on this home.
Original Mortgage
$255,000
Interest Rate
6.35%
Mortgage Type
Purchase Money Mortgage
Purchase Details
Closed on
May 30, 2007
Sold by
Kutcher William P and Kutcher Clementina R
Bought by
Kutcher William P and Kutcher Clementina R
Purchase Details
Closed on
Mar 29, 2006
Sold by
Kutcher Brian and Kutcher Clementina R
Bought by
Kutcher Clementina R and Kutcher William P
Create a Home Valuation Report for This Property
The Home Valuation Report is an in-depth analysis detailing your home's value as well as a comparison with similar homes in the area
Home Values in the Area
Average Home Value in this Area
Purchase History
| Date | Buyer | Sale Price | Title Company |
|---|---|---|---|
| Tofani James J | -- | -- | |
| Mcinnis Geraldine C | $355,000 | -- | |
| Kutcher William P | -- | -- | |
| Kutcher Clementina R | -- | -- |
Source: Public Records
Mortgage History
| Date | Status | Borrower | Loan Amount |
|---|---|---|---|
| Previous Owner | Mcinnis Geraldine C | $255,000 |
Source: Public Records
Tax History
| Year | Tax Paid | Tax Assessment Tax Assessment Total Assessment is a certain percentage of the fair market value that is determined by local assessors to be the total taxable value of land and additions on the property. | Land | Improvement |
|---|---|---|---|---|
| 2025 | $6,839 | $544,500 | $167,900 | $376,600 |
| 2024 | $6,538 | $508,400 | $153,300 | $355,100 |
| 2023 | $6,161 | $472,100 | $146,000 | $326,100 |
| 2022 | $5,721 | $406,300 | $121,700 | $284,600 |
| 2021 | $5,536 | $384,200 | $121,700 | $262,500 |
| 2020 | $5,284 | $371,600 | $121,700 | $249,900 |
| 2019 | $5,172 | $364,000 | $121,700 | $242,300 |
| 2018 | $4,954 | $343,800 | $117,000 | $226,800 |
| 2017 | $4,798 | $334,600 | $117,000 | $217,600 |
| 2016 | $4,574 | $320,100 | $115,100 | $205,000 |
| 2015 | $4,386 | $307,800 | $110,700 | $197,100 |
| 2014 | $4,395 | $299,800 | $108,100 | $191,700 |
Source: Public Records
Map
Nearby Homes
- 23 Bellwood Cir Unit 23
- 31 Bellwood Cir Unit 31B
- 1 Evergreen Dr Unit 1
- 123-125 Mendon St
- 7 Palmetto Dr Unit 7
- 7 Debra Ln Unit 1
- 67 Blackstone St
- 125 Blackstone St
- 3003 Maple Brook Rd Unit 3003
- 1501 Old Bridge Ln Unit 1501
- 1 Whitman Cir Unit 1
- 3 Whitman Cir Unit 3
- 5 Whitman Cir Unit 5
- 640 Maple Brook Rd
- 48 Donna Rd
- 95 Lisa Ann Dr
- 6 Barrows Rd
- 60 Wethersfield Rd
- 67 Jeannine Rd
- 0 Hartford Ave
- 0 Edgehill Lane Lot 28
- 8 Brookside Rd
- 4 Brookside Rd
- 5 Thayer Rd
- 8 Mendon St
- 20 Mendon St
- 12 Brookside Rd
- 3 Brookside Rd
- 4 Edgehill Ln
- 16 Brookside Rd
- 24 Mendon St
- 0 Woodside Lane Lot 27
- 4 Woodside Ln
- 7 Edgehill Ln
- 7 Mechanic St
- 1 Mechanic St
- 13 Mechanic St
- 19 Brookside Rd
- 15 Mechanic St
- 28 Mendon St
Your Personal Tour Guide
Ask me questions while you tour the home.