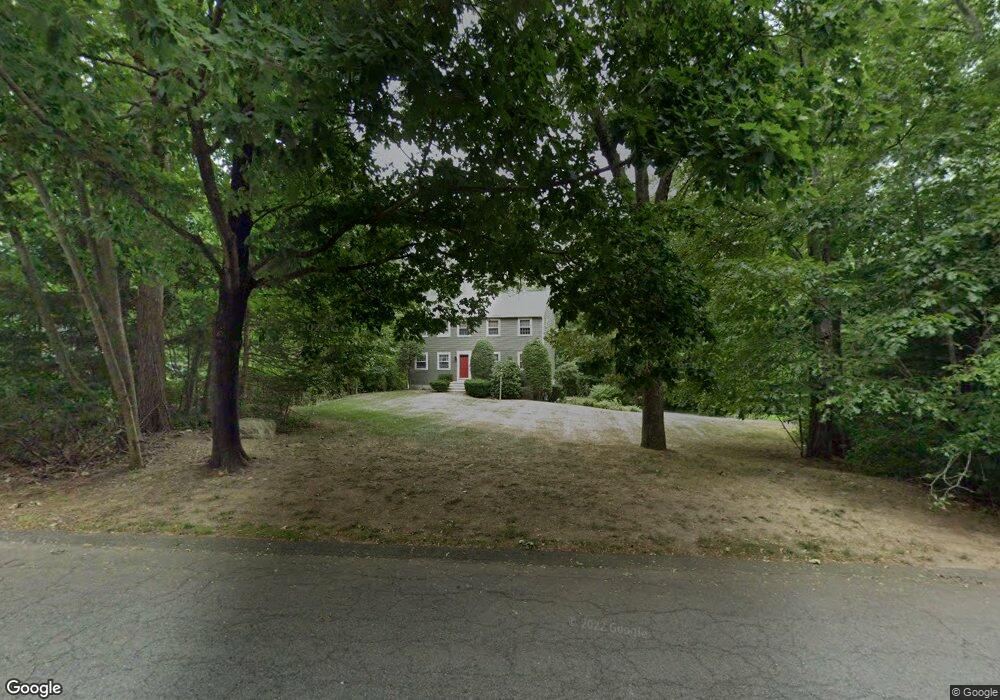
4 Violet Cir Milford, MA 01757
Estimated Value: $620,389 - $737,000
4
Beds
3
Baths
2,016
Sq Ft
$332/Sq Ft
Est. Value
About This Home
This home is located at 4 Violet Cir, Milford, MA 01757 and is currently estimated at $669,597, approximately $332 per square foot. 4 Violet Cir is a home located in Worcester County with nearby schools including Milford High School.
Ownership History
Date
Name
Owned For
Owner Type
Purchase Details
Closed on
Jan 21, 2021
Sold by
Oleary Mary R and Oleary Stephen D
Bought by
Sm Oleary Ft
Current Estimated Value
Purchase Details
Closed on
Sep 30, 1992
Sold by
Pough Marguerite and Pough Edward
Bought by
Oleary Stephen and Oleary Mary
Home Financials for this Owner
Home Financials are based on the most recent Mortgage that was taken out on this home.
Original Mortgage
$92,000
Interest Rate
7.83%
Mortgage Type
Purchase Money Mortgage
Create a Home Valuation Report for This Property
The Home Valuation Report is an in-depth analysis detailing your home's value as well as a comparison with similar homes in the area
Home Values in the Area
Average Home Value in this Area
Purchase History
| Date | Buyer | Sale Price | Title Company |
|---|---|---|---|
| Sm Oleary Ft | -- | None Available | |
| Oleary Stephen | $184,000 | -- |
Source: Public Records
Mortgage History
| Date | Status | Borrower | Loan Amount |
|---|---|---|---|
| Previous Owner | Oleary Stephen | $127,000 | |
| Previous Owner | Oleary Stephen | $80,000 | |
| Previous Owner | Oleary Stephen | $92,000 |
Source: Public Records
Tax History
| Year | Tax Paid | Tax Assessment Tax Assessment Total Assessment is a certain percentage of the fair market value that is determined by local assessors to be the total taxable value of land and additions on the property. | Land | Improvement |
|---|---|---|---|---|
| 2025 | $6,970 | $544,500 | $202,400 | $342,100 |
| 2024 | $6,900 | $519,200 | $194,300 | $324,900 |
| 2023 | $6,495 | $449,500 | $168,000 | $281,500 |
| 2022 | $6,076 | $394,800 | $153,800 | $241,000 |
| 2021 | $5,807 | $363,400 | $153,800 | $209,600 |
| 2020 | $5,723 | $358,600 | $153,800 | $204,800 |
| 2019 | $5,566 | $336,500 | $153,800 | $182,700 |
| 2018 | $5,506 | $332,500 | $149,800 | $182,700 |
| 2017 | $5,336 | $317,800 | $149,800 | $168,000 |
| 2016 | $5,264 | $306,400 | $149,800 | $156,600 |
| 2015 | $5,135 | $292,600 | $141,700 | $150,900 |
Source: Public Records
Map
Nearby Homes
- 44 Silver Hill Rd
- 9 Robin Rd
- 24 Camp St
- 5 Sidney Rd
- 241 Purchase St
- 20 Cornell Dr
- 10 Yale Dr
- 25 Haven St
- 37 Godfrey Ln
- 4 Kennedy Ln Unit 47
- 21 Shadowbrook Ln Unit 13
- 130 Purchase St
- 8 Shadowbrook Ln Unit 39
- 8 Shadowbrook Ln Unit 41
- 9 Shadowbrook Ln Unit 1
- 8 Bandy Ln
- 6 Dilla St
- 0 Mcgill Ln
- 11 Country Club Ln Unit D
- 5 Country Club Ln Unit B
Your Personal Tour Guide
Ask me questions while you tour the home.