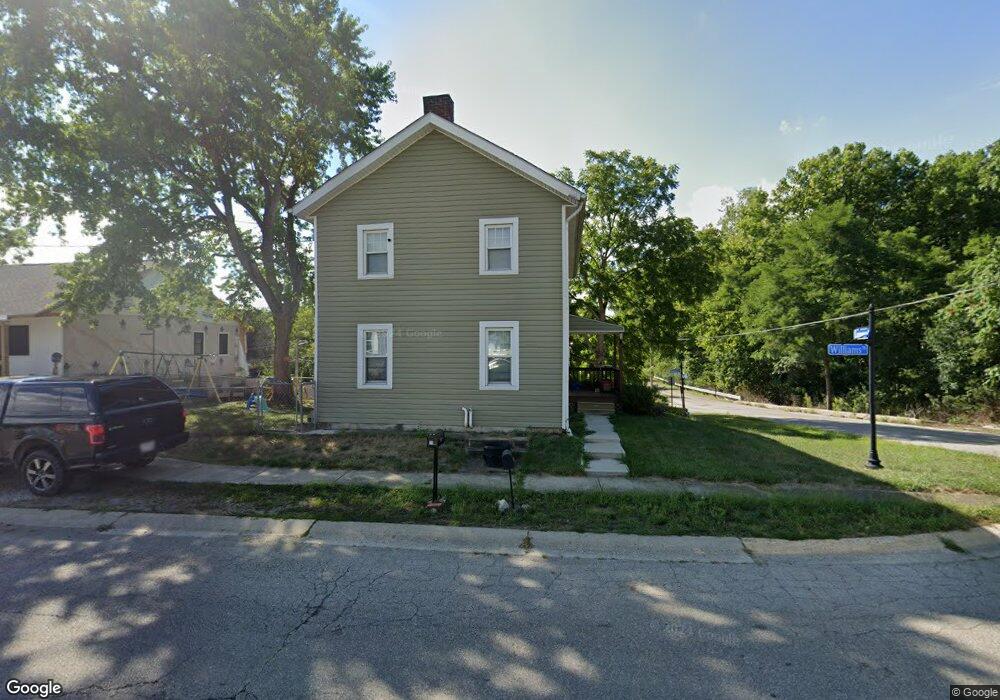
4 Williams St Unit 1 Lockbourne, OH 43137
Obetz-Lockbourne NeighborhoodEstimated Value: $229,000 - $322,000
3
Beds
2
Baths
1,600
Sq Ft
$165/Sq Ft
Est. Value
About This Home
This home is located at 4 Williams St Unit 1, Lockbourne, OH 43137 and is currently estimated at $264,298, approximately $165 per square foot. 4 Williams St Unit 1 is a home located in Franklin County with nearby schools including Hamilton Elementary School, Hamilton Intermediate School, and Hamilton Middle School.
Ownership History
Date
Name
Owned For
Owner Type
Purchase Details
Closed on
Oct 24, 2019
Sold by
Shaw Drew and Shaw Jennifer M
Bought by
Boldrin Ryan and Boldrin Tatiana
Current Estimated Value
Home Financials for this Owner
Home Financials are based on the most recent Mortgage that was taken out on this home.
Original Mortgage
$88,000
Outstanding Balance
$76,824
Interest Rate
3.65%
Estimated Equity
$187,474
Purchase Details
Closed on
Apr 23, 2006
Sold by
Wells Fargo Bank Na
Bought by
Shaw Drew
Home Financials for this Owner
Home Financials are based on the most recent Mortgage that was taken out on this home.
Original Mortgage
$42,300
Interest Rate
6.68%
Mortgage Type
Fannie Mae Freddie Mac
Purchase Details
Closed on
Apr 13, 2005
Sold by
Weaver Wendell W and Case #04Cve08 8734
Bought by
Wells Fargo Bank Na and Structured Asset Securities Corp Amortiz
Purchase Details
Closed on
Aug 20, 1979
Bought by
Weaver Wendell W
Create a Home Valuation Report for This Property
The Home Valuation Report is an in-depth analysis detailing your home's value as well as a comparison with similar homes in the area
Home Values in the Area
Average Home Value in this Area
Purchase History
| Date | Buyer | Sale Price | Title Company |
|---|---|---|---|
| Boldrin Ryan | $205,000 | Pm Title Box | |
| Shaw Drew | $27,900 | Titlequest | |
| Wells Fargo Bank Na | $50,000 | Independent | |
| Weaver Wendell W | -- | -- |
Source: Public Records
Mortgage History
| Date | Status | Borrower | Loan Amount |
|---|---|---|---|
| Open | Boldrin Ryan | $88,000 | |
| Previous Owner | Shaw Drew | $42,300 |
Source: Public Records
Tax History
| Year | Tax Paid | Tax Assessment Tax Assessment Total Assessment is a certain percentage of the fair market value that is determined by local assessors to be the total taxable value of land and additions on the property. | Land | Improvement |
|---|---|---|---|---|
| 2025 | $2,622 | $53,490 | $11,940 | $41,550 |
| 2024 | $2,622 | $53,490 | $11,940 | $41,550 |
| 2023 | $2,583 | $53,480 | $11,935 | $41,545 |
| 2022 | $1,998 | $35,110 | $4,100 | $31,010 |
| 2021 | $2,025 | $35,110 | $4,100 | $31,010 |
| 2020 | $2,326 | $35,110 | $4,100 | $31,010 |
| 2019 | $1,734 | $26,950 | $3,430 | $23,520 |
| 2018 | $1,558 | $26,950 | $3,430 | $23,520 |
| 2017 | $1,326 | $26,950 | $3,430 | $23,520 |
| 2016 | $986 | $14,740 | $2,910 | $11,830 |
| 2015 | $1,378 | $14,740 | $2,910 | $11,830 |
| 2014 | $932 | $14,740 | $2,910 | $11,830 |
| 2013 | $592 | $16,345 | $3,220 | $13,125 |
Source: Public Records
Map
Nearby Homes
- 11 Plumb St
- 64 Commerce St
- 1303 Theodore Dr
- 9520 Picway Rd
- 10610 E State Route 762 Unit 23 B
- 10694 E State Route 762
- 6515 S High St
- 156 Buckeye Cir
- 117 Buckeye Cir Unit B117
- 129 Buckeye Cir Unit B129
- 124 Buckeye Cir Unit B124
- 134 Buckeye Cir Unit B132
- 4 Oak Rd Unit 4
- 10874 Bulen Pierce Rd
- 10910 Bulen Pierce Rd
- 219 Buckeye Cir Unit B129
- 10942 Bulen Pierce Rd
- 10976 Bulen Pierce Rd
- 3357 London Groveport Rd
- 2864 W Old Duvall Ct
- 4 Williams St
- 4 Williams Ave
- 14 Williams Ave
- 160 Commerce St
- 15 Williams St
- 161 Commercial Dr
- 170 Commerce St
- 188 Commerce St
- 18 Williams St
- 22 Williams St
- 191 Commerce St
- 17 Williams Ave
- 17 Williams Ave
- 20 Commerce St
- 206 Commercial Dr
- 12 Williams Ave
- 34 Williams St
- 36 Williams St
- 146 Commerce A St
- 169 Mechanics St
Your Personal Tour Guide
Ask me questions while you tour the home.