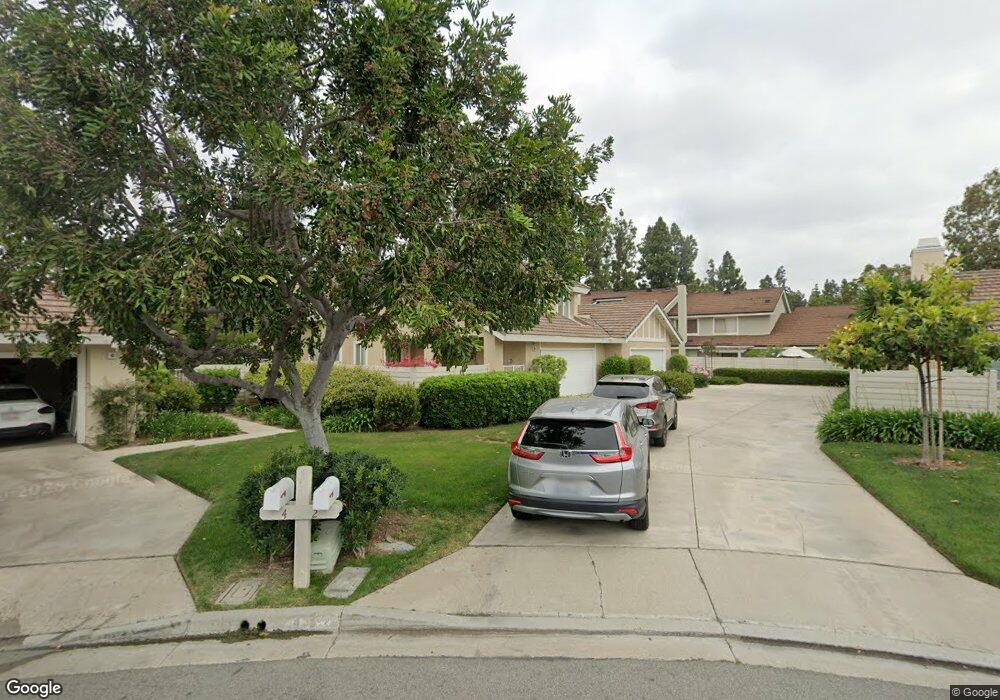
4 Windsong Unit 66 Irvine, CA 92614
Woodbridge NeighborhoodEstimated Value: $1,314,000 - $1,560,454
3
Beds
3
Baths
2,092
Sq Ft
$702/Sq Ft
Est. Value
About This Home
This home is located at 4 Windsong Unit 66, Irvine, CA 92614 and is currently estimated at $1,468,864, approximately $702 per square foot. 4 Windsong Unit 66 is a home located in Orange County with nearby schools including Meadow Park School, South Lake Middle School, and Woodbridge High School.
Ownership History
Date
Name
Owned For
Owner Type
Purchase Details
Closed on
Dec 23, 2022
Sold by
Park Jong Tam and Park Kyung Ae
Bought by
Kyung Ae Kim And Jong Tam Park Revocable Livi
Current Estimated Value
Purchase Details
Closed on
May 1, 2009
Sold by
Lee James and Lee Kathy
Bought by
Park Jong Tam and Kim Kyung Ae
Purchase Details
Closed on
Aug 29, 2002
Sold by
Lee James and Lee Kathy
Bought by
Lee James and Lee Kathy
Home Financials for this Owner
Home Financials are based on the most recent Mortgage that was taken out on this home.
Original Mortgage
$200,000
Interest Rate
6.29%
Purchase Details
Closed on
Aug 9, 1993
Sold by
Wiesener Robert W and Wiesener Alma E
Bought by
Mccracken Gerald B and Mccracken Sharon W
Home Financials for this Owner
Home Financials are based on the most recent Mortgage that was taken out on this home.
Original Mortgage
$185,000
Interest Rate
7.21%
Create a Home Valuation Report for This Property
The Home Valuation Report is an in-depth analysis detailing your home's value as well as a comparison with similar homes in the area
Home Values in the Area
Average Home Value in this Area
Purchase History
| Date | Buyer | Sale Price | Title Company |
|---|---|---|---|
| Kyung Ae Kim And Jong Tam Park Revocable Livi | -- | -- | |
| Park Jong Tam | $645,000 | Western Resources Title Co | |
| Lee James | -- | Commonwealth Land Title | |
| Mccracken Gerald B | $270,000 | South Coast Title Company |
Source: Public Records
Mortgage History
| Date | Status | Borrower | Loan Amount |
|---|---|---|---|
| Previous Owner | Lee James | $200,000 | |
| Previous Owner | Mccracken Gerald B | $185,000 |
Source: Public Records
Tax History
| Year | Tax Paid | Tax Assessment Tax Assessment Total Assessment is a certain percentage of the fair market value that is determined by local assessors to be the total taxable value of land and additions on the property. | Land | Improvement |
|---|---|---|---|---|
| 2025 | $8,704 | $830,598 | $604,349 | $226,249 |
| 2024 | $8,704 | $814,312 | $592,499 | $221,813 |
| 2023 | $8,479 | $798,346 | $580,882 | $217,464 |
| 2022 | $8,317 | $782,693 | $569,493 | $213,200 |
| 2021 | $8,127 | $767,347 | $558,327 | $209,020 |
| 2020 | $8,081 | $759,479 | $552,602 | $206,877 |
| 2019 | $7,901 | $744,588 | $541,767 | $202,821 |
| 2018 | $7,762 | $729,989 | $531,144 | $198,845 |
| 2017 | $7,601 | $715,676 | $520,729 | $194,947 |
| 2016 | $7,265 | $701,644 | $510,519 | $191,125 |
| 2015 | $7,102 | $691,105 | $502,850 | $188,255 |
| 2014 | $6,963 | $677,568 | $493,000 | $184,568 |
Source: Public Records
Map
Nearby Homes
- 59 Fox Hollow Unit 36
- 26 Claret Unit 40
- 53 Woodleaf
- 11 Thunder Trail Unit 6
- 111 Greenfield
- 94 Greenfield Unit 99
- 7 Spring Buck
- 5 Cannes
- 6 Whitecloud
- 94 Smokestone
- 18 Decente
- 7 Onyx Unit 11
- 32 Spinnaker Unit 71
- 3871 Hendrix St
- 19 Waterway Unit 9
- 154 Echo Run Unit 66
- 52 Weepingwood
- 30 Waterway Unit 43
- 191 Rockwood Unit 62
- 6 Aprilla
- 2 Windsong Unit 1
- 2 Windsong
- 6 Windsong
- 8 Windsong
- 38 Summerwind
- 36 Havenwood Unit 60
- 36 Summerwind
- 39 Summerwind Unit 31
- 39 Summerwind
- 34 Summerwind
- 12 Windsong
- 37 Summerwind
- 32 Summerwind
- 15 Windsong
- 44 Havenwood Unit 56
- 35 Summerwind
- 4 Eagle Run
- 14 Windsong Unit 61
- 17 Windsong
- 26 Havenwood Unit 65
Your Personal Tour Guide
Ask me questions while you tour the home.