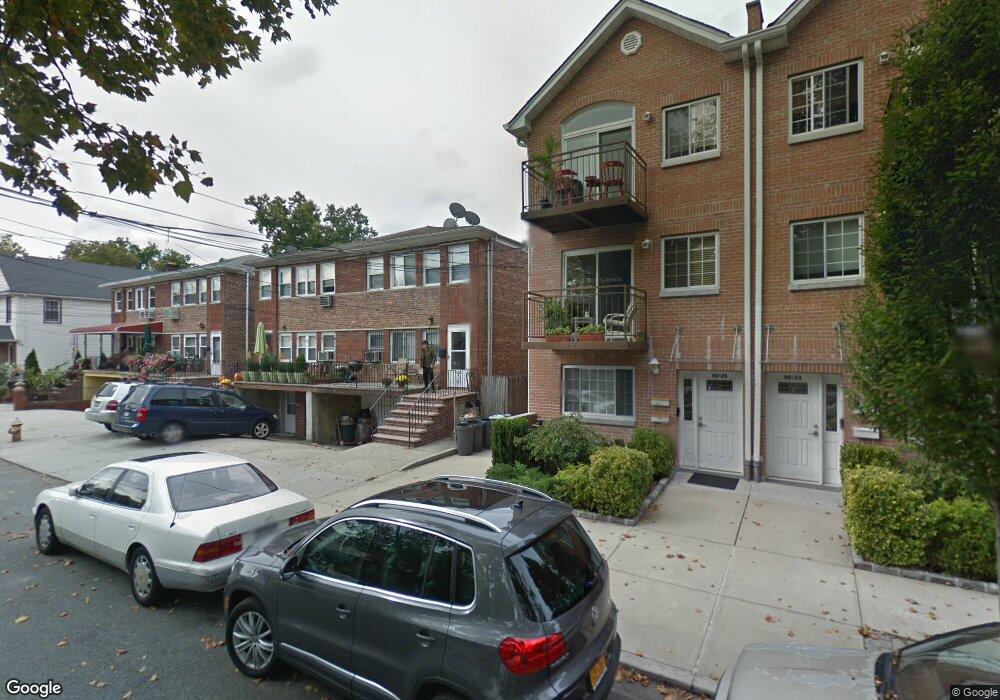
40-28 193rd St Unit 2Fl Flushing, NY 11358
Auburndale NeighborhoodEstimated Value: $1,128,000 - $1,232,830
2
Beds
1
Bath
1,000
Sq Ft
$1,188/Sq Ft
Est. Value
About This Home
This home is located at 40-28 193rd St Unit 2Fl, Flushing, NY 11358 and is currently estimated at $1,188,458, approximately $1,188 per square foot. 40-28 193rd St Unit 2Fl is a home located in Queens County with nearby schools including P.S. 31 - Bayside, I.S. 25 Adrien Block, and Francis Lewis High School.
Ownership History
Date
Name
Owned For
Owner Type
Purchase Details
Closed on
Apr 12, 2007
Sold by
Tso Clement and Tso Lin Lo
Bought by
Wang Jin Dong and Wang Ren Ai
Current Estimated Value
Home Financials for this Owner
Home Financials are based on the most recent Mortgage that was taken out on this home.
Original Mortgage
$173,000
Outstanding Balance
$104,255
Interest Rate
6.18%
Estimated Equity
$1,084,203
Purchase Details
Closed on
Dec 29, 2006
Sold by
Voiklis Anna and Voiklis James
Bought by
Tso Clement and Tso Lin Lo
Purchase Details
Closed on
Mar 2, 1995
Sold by
Meyer Renata and Meyer Christian
Bought by
Voiklis James and Voiklis John
Home Financials for this Owner
Home Financials are based on the most recent Mortgage that was taken out on this home.
Original Mortgage
$145,000
Interest Rate
8.78%
Create a Home Valuation Report for This Property
The Home Valuation Report is an in-depth analysis detailing your home's value as well as a comparison with similar homes in the area
Home Values in the Area
Average Home Value in this Area
Purchase History
| Date | Buyer | Sale Price | Title Company |
|---|---|---|---|
| Wang Jin Dong | $695,000 | -- | |
| Wang Jin Dong | $695,000 | -- | |
| Tso Clement | $661,000 | -- | |
| Tso Clement | $661,000 | -- | |
| Voiklis James | $230,000 | -- | |
| Voiklis James | $230,000 | -- |
Source: Public Records
Mortgage History
| Date | Status | Borrower | Loan Amount |
|---|---|---|---|
| Open | Wang Jin Dong | $173,000 | |
| Closed | Wang Jin Dong | $173,000 | |
| Open | Wang Jin Dong | $451,750 | |
| Closed | Wang Jin Dong | $451,750 | |
| Previous Owner | Voiklis James | $145,000 |
Source: Public Records
Tax History
| Year | Tax Paid | Tax Assessment Tax Assessment Total Assessment is a certain percentage of the fair market value that is determined by local assessors to be the total taxable value of land and additions on the property. | Land | Improvement |
|---|---|---|---|---|
| 2025 | $8,796 | $46,420 | $12,716 | $33,704 |
| 2024 | $8,796 | $43,793 | $13,048 | $30,745 |
| 2023 | $8,796 | $43,793 | $12,065 | $31,728 |
| 2022 | $8,254 | $59,820 | $17,340 | $42,480 |
| 2021 | $8,629 | $58,080 | $17,340 | $40,740 |
| 2020 | $8,188 | $63,840 | $17,340 | $46,500 |
| 2019 | $7,634 | $70,140 | $17,340 | $52,800 |
| 2018 | $7,439 | $36,494 | $9,484 | $27,010 |
| 2017 | $7,383 | $36,219 | $12,859 | $23,360 |
| 2016 | $6,831 | $36,219 | $12,859 | $23,360 |
| 2015 | $4,121 | $32,236 | $12,131 | $20,105 |
| 2014 | $4,121 | $30,412 | $13,730 | $16,682 |
Source: Public Records
Map
Nearby Homes
- 40-38 194th St Unit 1A
- 4038 194th St Unit 3B
- 4048 194th St Unit A3
- 4032 195th St
- 19112 Station Rd
- 193-02 39th Ave Unit 1
- 194-23 Station Rd
- 190-17 42nd Ave
- 191-02 39th Ave
- 191-9 39th Ave Unit 164
- 195-33 39th Ave
- 190-05 39th Ave Unit 142
- 195-31 39th Ave
- 189-23 39th Ave Unit 122
- 37-6 Francis Lewis Blvd
- 37-02 Francis Lewis Blvd
- 3617 194th St
- 37-08 Francis Lewis Blvd
- 36-20 194th St Unit 3r
- 42-25 189th St
- 4028 193rd St
- 4030 193rd St
- 4030 193rd St Unit 2Fl
- 4030 193rd St Unit 1Fl+Ba
- 4030 193rd St
- 4026 193rd St
- 4032 193rd St
- 4024 193rd St
- 4034 193rd St
- 40-34 193rd St Unit 2
- 40-34 193rd St Unit 1
- 40-29 192nd St Unit F01
- 40-29 192nd St Unit 2
- 4025 192nd St Unit 3
- 4018 193rd St
- 4017 192nd St Unit 4
- 40-17 192nd St
- 4038 193rd St
- 40-31 192nd St Unit G03
- 4035 192nd St Unit 5
Your Personal Tour Guide
Ask me questions while you tour the home.