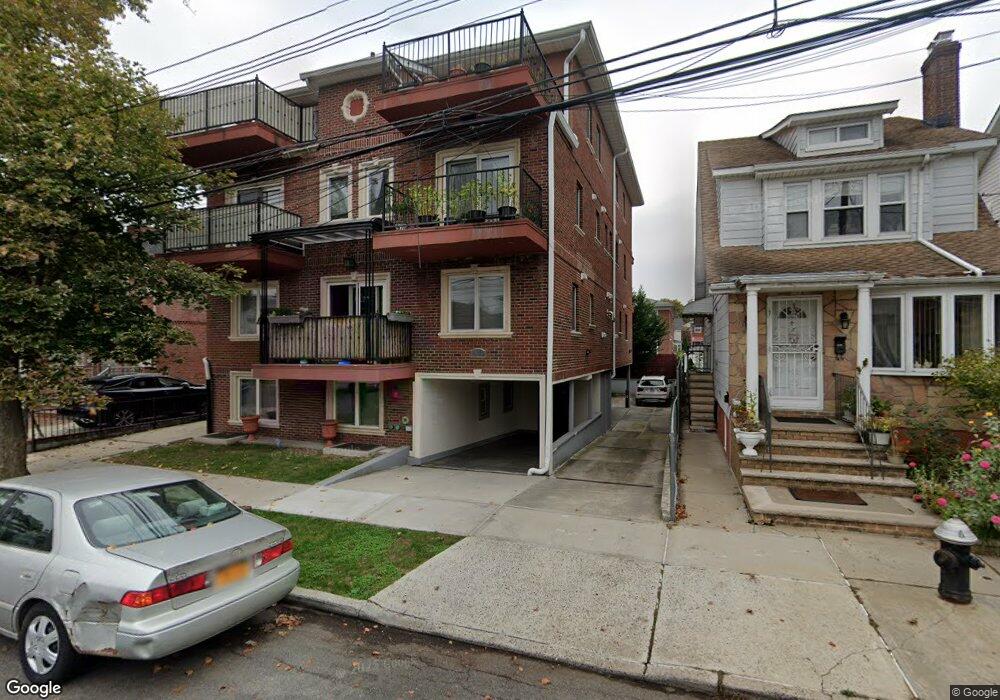
40-38 194th St Unit 3C Flushing, NY 11358
Auburndale NeighborhoodEstimated Value: $564,000 - $725,000
2
Beds
2
Baths
866
Sq Ft
$725/Sq Ft
Est. Value
About This Home
This home is located at 40-38 194th St Unit 3C, Flushing, NY 11358 and is currently estimated at $628,093, approximately $725 per square foot. 40-38 194th St Unit 3C is a home located in Queens County with nearby schools including P.S. 31 - Bayside, I.S. 25 Adrien Block, and Francis Lewis High School.
Ownership History
Date
Name
Owned For
Owner Type
Purchase Details
Closed on
Mar 5, 2024
Sold by
Fung Dennis
Bought by
Fung Dennis and Fung Heung Lai
Current Estimated Value
Purchase Details
Closed on
Sep 7, 2016
Sold by
Lee Chong Yea and Lee Sun Joo
Bought by
Fung Dennis
Home Financials for this Owner
Home Financials are based on the most recent Mortgage that was taken out on this home.
Original Mortgage
$447,000
Outstanding Balance
$355,105
Interest Rate
3.43%
Mortgage Type
New Conventional
Estimated Equity
$272,988
Purchase Details
Closed on
Dec 15, 2010
Sold by
Auburndale Bay Associates Llc
Bought by
Lee Chong Yea and Lee Sun Joo
Home Financials for this Owner
Home Financials are based on the most recent Mortgage that was taken out on this home.
Original Mortgage
$170,000
Interest Rate
4.37%
Mortgage Type
Purchase Money Mortgage
Create a Home Valuation Report for This Property
The Home Valuation Report is an in-depth analysis detailing your home's value as well as a comparison with similar homes in the area
Home Values in the Area
Average Home Value in this Area
Purchase History
| Date | Buyer | Sale Price | Title Company |
|---|---|---|---|
| Fung Dennis | -- | -- | |
| Fung Dennis | -- | -- | |
| Fung Dennis | $597,000 | -- | |
| Fung Dennis | $597,000 | -- | |
| Lee Chong Yea | $451,230 | -- | |
| Lee Chong Yea | $451,230 | -- |
Source: Public Records
Mortgage History
| Date | Status | Borrower | Loan Amount |
|---|---|---|---|
| Open | Fung Dennis | $447,000 | |
| Closed | Fung Dennis | $447,000 | |
| Previous Owner | Lee Chong Yea | $170,000 |
Source: Public Records
Tax History
| Year | Tax Paid | Tax Assessment Tax Assessment Total Assessment is a certain percentage of the fair market value that is determined by local assessors to be the total taxable value of land and additions on the property. | Land | Improvement |
|---|---|---|---|---|
| 2025 | $6,118 | $84,352 | $15,749 | $68,603 |
| 2024 | $6,118 | $78,801 | $15,749 | $63,052 |
| 2023 | $4,199 | $77,761 | $15,749 | $62,012 |
| 2022 | $2,549 | $106,570 | $15,750 | $90,820 |
| 2021 | $507 | $110,388 | $15,750 | $94,638 |
| 2020 | $512 | $118,550 | $15,750 | $102,800 |
| 2019 | $517 | $116,969 | $15,750 | $101,219 |
| 2018 | $526 | $111,216 | $15,749 | $95,467 |
| 2017 | $526 | $110,189 | $15,749 | $94,440 |
| 2016 | $533 | $110,189 | $15,749 | $94,440 |
| 2015 | -- | $109,974 | $15,749 | $94,225 |
| 2014 | -- | $89,853 | $12,902 | $76,951 |
Source: Public Records
Map
Nearby Homes
- 40-38 194th St Unit 1A
- 4038 194th St Unit 3B
- 4048 194th St Unit A3
- 4032 195th St
- 194-23 Station Rd
- 19112 Station Rd
- 193-02 39th Ave Unit 1
- 190-17 42nd Ave
- 195-33 39th Ave
- 191-02 39th Ave
- 191-9 39th Ave Unit 164
- 195-31 39th Ave
- 37-6 Francis Lewis Blvd
- 190-05 39th Ave Unit 142
- 37-08 Francis Lewis Blvd
- 37-02 Francis Lewis Blvd
- 42-25 189th St
- 3617 194th St
- 189-23 39th Ave Unit 122
- 43-44 195th St
- 40-38 194th St Unit 2B
- 40-38 194th St Unit A-1
- 40-38 194th St Unit 3
- 40-38 194th St
- 40-38 194th St Unit 2A
- 4038 194th St Unit 3A
- 4038 194th St Unit P4
- 4038 194th St Unit 2B
- 4038 194th St Unit P5
- 4038 194th St Unit 3C
- 4038 194th St Unit P7
- 4038 194th St Unit 3D
- 4038 194th St Unit 1A
- 4038 194th St Unit 2A
- 4038 194th St Unit P6
- 4038 194th St Unit 40-38
- 4038 194th St Unit 3B
- 4038 194th St
- 4038-P1 194th St Unit P1&P2
- 4040 194th St
Your Personal Tour Guide
Ask me questions while you tour the home.