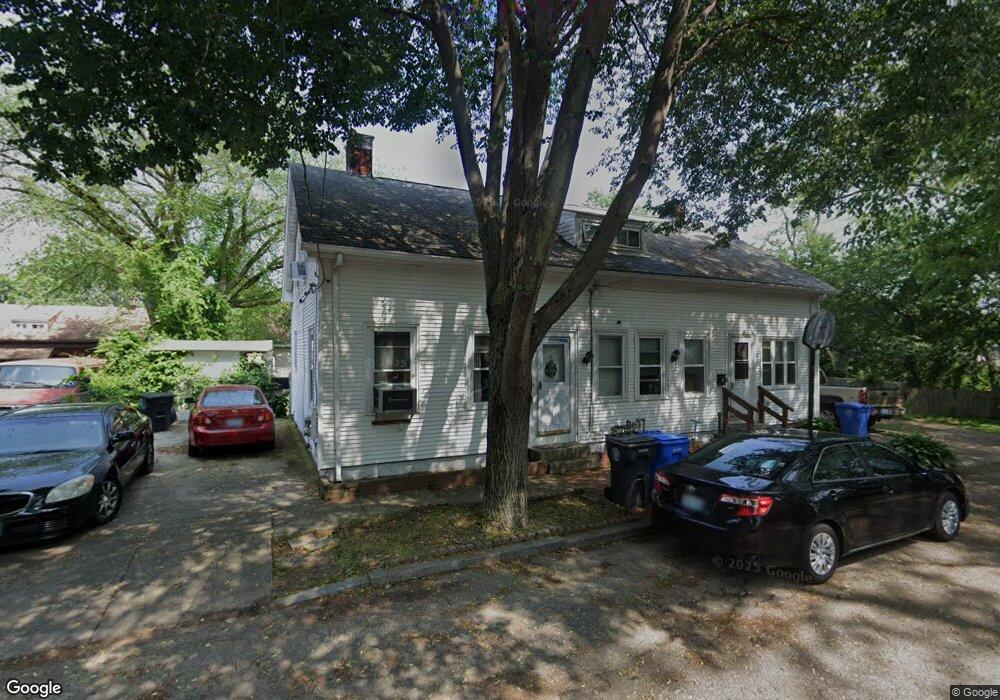
40 Cedar St Cranston, RI 02910
Village NeighborhoodEstimated Value: $426,924 - $452,000
4
Beds
2
Baths
1,782
Sq Ft
$247/Sq Ft
Est. Value
About This Home
This home is located at 40 Cedar St, Cranston, RI 02910 and is currently estimated at $440,981, approximately $247 per square foot. 40 Cedar St is a home located in Providence County with nearby schools including Stadium Elementary School, Hugh B. Bain Middle School, and Cranston High School East.
Ownership History
Date
Name
Owned For
Owner Type
Purchase Details
Closed on
May 2, 2016
Sold by
Mary G Basler
Bought by
Pearson Julia M and Pearson Michael A
Current Estimated Value
Home Financials for this Owner
Home Financials are based on the most recent Mortgage that was taken out on this home.
Original Mortgage
$499,920
Outstanding Balance
$396,895
Interest Rate
3.66%
Estimated Equity
$44,086
Create a Home Valuation Report for This Property
The Home Valuation Report is an in-depth analysis detailing your home's value as well as a comparison with similar homes in the area
Home Values in the Area
Average Home Value in this Area
Purchase History
| Date | Buyer | Sale Price | Title Company |
|---|---|---|---|
| Pearson Julia M | -- | -- |
Source: Public Records
Mortgage History
| Date | Status | Borrower | Loan Amount |
|---|---|---|---|
| Open | Pearson Julia M | $499,920 | |
| Closed | Pearson Julia M | -- | |
| Previous Owner | Pearson Julia M | $122,000 |
Source: Public Records
Tax History Compared to Growth
Tax History
| Year | Tax Paid | Tax Assessment Tax Assessment Total Assessment is a certain percentage of the fair market value that is determined by local assessors to be the total taxable value of land and additions on the property. | Land | Improvement |
|---|---|---|---|---|
| 2025 | $4,737 | $341,300 | $88,100 | $253,200 |
| 2024 | $4,471 | $328,500 | $88,100 | $240,400 |
| 2023 | $4,392 | $232,400 | $60,800 | $171,600 |
| 2022 | $4,302 | $232,400 | $60,800 | $171,600 |
| 2021 | $4,183 | $232,400 | $60,800 | $171,600 |
| 2020 | $3,830 | $184,400 | $47,300 | $137,100 |
| 2019 | $3,830 | $184,400 | $47,300 | $137,100 |
| 2018 | $3,741 | $184,400 | $47,300 | $137,100 |
| 2017 | $3,095 | $134,900 | $37,100 | $97,800 |
| 2016 | $3,029 | $134,900 | $37,100 | $97,800 |
| 2015 | $3,029 | $134,900 | $37,100 | $97,800 |
| 2014 | $3,437 | $150,500 | $37,100 | $113,400 |
Source: Public Records
Map
Nearby Homes
- 174 Gansett Ave
- 55 Columbus Blvd
- 46 Roslyn Ave
- 63 Packard St
- 80 Packard St
- 92 Rhode Island St
- 7 Cleveland Ave
- 18 Standish Ave
- 9 Southern St
- 1303 Cranston St
- 0 Doane St
- 0 Fiat Ave
- 2 Gansett Ave
- 70 Florida Ave
- 111 Belgium St
- 761 Dyer Ave
- 14 New Hampshire St
- 1574 Cranston St
- 24-26 Pendleton St
- 18 Doane St