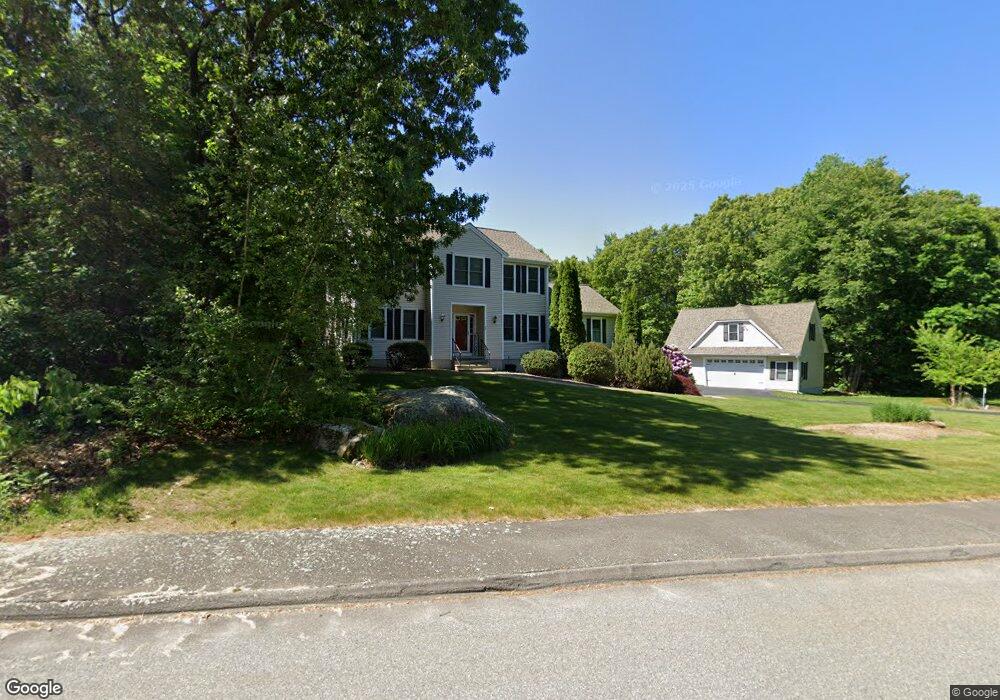
40 Evans Way Uxbridge, MA 01569
Estimated Value: $705,000 - $804,000
4
Beds
3
Baths
2,562
Sq Ft
$292/Sq Ft
Est. Value
About This Home
This home is located at 40 Evans Way, Uxbridge, MA 01569 and is currently estimated at $748,467, approximately $292 per square foot. 40 Evans Way is a home located in Worcester County with nearby schools including Uxbridge High School and Our Lady of the Valley Regional School.
Ownership History
Date
Name
Owned For
Owner Type
Purchase Details
Closed on
Jun 26, 2009
Sold by
Oconnell Stephen J and Oconnell Laura H
Bought by
Oconnell Stephen J and Oconnell Laura H
Current Estimated Value
Purchase Details
Closed on
Sep 26, 2003
Sold by
Fncl Cendant Mobility
Bought by
Hollister Laura H and Oconnell Stephen J
Home Financials for this Owner
Home Financials are based on the most recent Mortgage that was taken out on this home.
Original Mortgage
$306,000
Interest Rate
6.29%
Mortgage Type
Purchase Money Mortgage
Purchase Details
Closed on
Jul 21, 1997
Sold by
Cnossen Timothy
Bought by
Landeck Harry A and Landeck Terri J
Home Financials for this Owner
Home Financials are based on the most recent Mortgage that was taken out on this home.
Original Mortgage
$150,000
Interest Rate
7.79%
Mortgage Type
Purchase Money Mortgage
Create a Home Valuation Report for This Property
The Home Valuation Report is an in-depth analysis detailing your home's value as well as a comparison with similar homes in the area
Home Values in the Area
Average Home Value in this Area
Purchase History
| Date | Buyer | Sale Price | Title Company |
|---|---|---|---|
| Oconnell Stephen J | -- | -- | |
| Hollister Laura H | $386,000 | -- | |
| Fncl Cendant Mobility | $386,000 | -- | |
| Landeck Harry A | $52,500 | -- |
Source: Public Records
Mortgage History
| Date | Status | Borrower | Loan Amount |
|---|---|---|---|
| Open | Landeck Harry A | $275,000 | |
| Previous Owner | Hollister Laura H | $306,000 | |
| Previous Owner | Landeck Harry A | $150,000 | |
| Previous Owner | Landeck Harry A | $150,000 |
Source: Public Records
Tax History Compared to Growth
Tax History
| Year | Tax Paid | Tax Assessment Tax Assessment Total Assessment is a certain percentage of the fair market value that is determined by local assessors to be the total taxable value of land and additions on the property. | Land | Improvement |
|---|---|---|---|---|
| 2025 | $89 | $678,100 | $155,100 | $523,000 |
| 2024 | $8,452 | $654,200 | $147,300 | $506,900 |
| 2023 | $8,118 | $581,900 | $127,300 | $454,600 |
| 2022 | $7,419 | $489,400 | $111,600 | $377,800 |
| 2021 | $7,742 | $489,400 | $111,600 | $377,800 |
| 2020 | $7,622 | $455,300 | $119,400 | $335,900 |
| 2019 | $7,783 | $448,600 | $131,200 | $317,400 |
| 2018 | $7,581 | $441,500 | $131,200 | $310,300 |
| 2017 | $7,176 | $423,100 | $125,900 | $297,200 |
| 2016 | $6,986 | $397,600 | $96,700 | $300,900 |
| 2015 | $6,828 | $392,400 | $96,700 | $295,700 |
Source: Public Records
Map
Nearby Homes
- 60 Tyler Dr
- 7 Jefferson Ct Unit 7
- Layla Plan at Pine Ridge
- Ashley Plan at Pine Ridge
- Lily Plan at Pine Ridge
- Brooklyn Plan at Pine Ridge
- Tucker Plan at Pine Ridge
- Everleigh Plan at Pine Ridge
- 36 Elm St
- 0 Homestead Ave
- 307 N Main St
- 129 Elm St Unit Lot 7
- 100 Spring Hill Dr Unit 100
- 128 Mantell Rd
- 235 Rivulet St
- 48 Homeward Ave
- 138 Mantell Rd
- 145 Mantell Rd
- 169 Mantell Rd
- 137 Mantell Rd