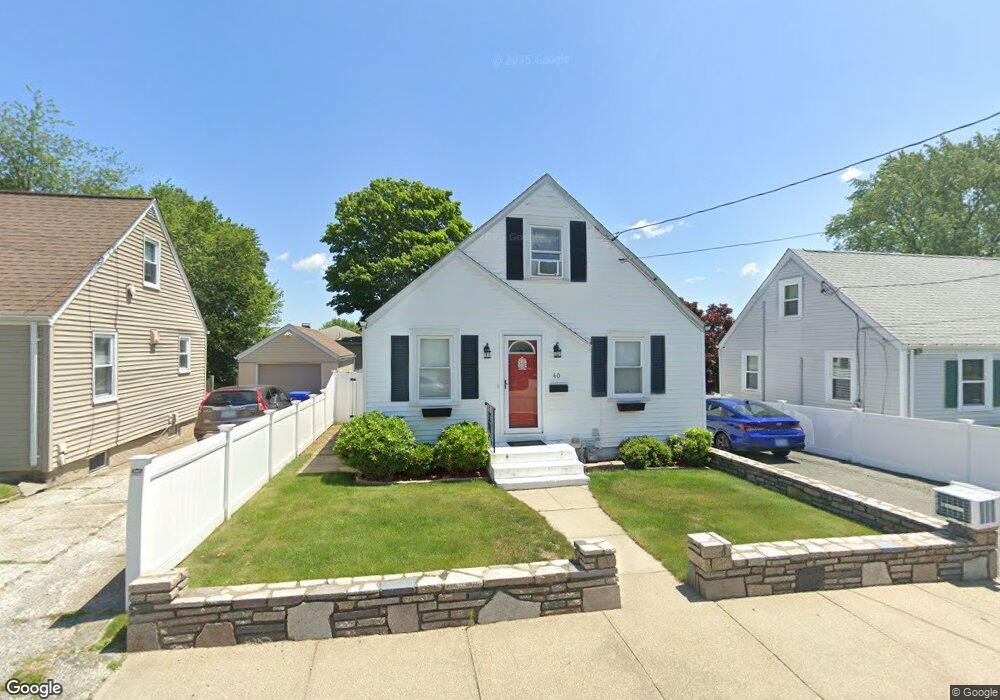
40 Fillmore St Pawtucket, RI 02860
Fairlawn NeighborhoodEstimated Value: $385,528 - $427,000
3
Beds
2
Baths
1,173
Sq Ft
$345/Sq Ft
Est. Value
About This Home
This home is located at 40 Fillmore St, Pawtucket, RI 02860 and is currently estimated at $404,382, approximately $344 per square foot. 40 Fillmore St is a home located in Providence County with nearby schools including Blackstone Valley Prep Upper Elementary School, The San Miguel School, and Bishop Keough Regional High School.
Ownership History
Date
Name
Owned For
Owner Type
Purchase Details
Closed on
May 20, 2003
Sold by
White Timothy R and White Donna M
Bought by
Bolcon Christopher P and Bolcon Nora P
Current Estimated Value
Home Financials for this Owner
Home Financials are based on the most recent Mortgage that was taken out on this home.
Original Mortgage
$173,057
Interest Rate
5.84%
Create a Home Valuation Report for This Property
The Home Valuation Report is an in-depth analysis detailing your home's value as well as a comparison with similar homes in the area
Home Values in the Area
Average Home Value in this Area
Purchase History
| Date | Buyer | Sale Price | Title Company |
|---|---|---|---|
| Bolcon Christopher P | $174,500 | -- |
Source: Public Records
Mortgage History
| Date | Status | Borrower | Loan Amount |
|---|---|---|---|
| Open | Bolcon Christopher P | $48,400 | |
| Open | Bolcon Christopher P | $198,000 | |
| Closed | Bolcon Christopher P | $173,057 | |
| Previous Owner | Bolcon Christopher P | $74,000 |
Source: Public Records
Tax History Compared to Growth
Tax History
| Year | Tax Paid | Tax Assessment Tax Assessment Total Assessment is a certain percentage of the fair market value that is determined by local assessors to be the total taxable value of land and additions on the property. | Land | Improvement |
|---|---|---|---|---|
| 2025 | $3,975 | $302,300 | $133,600 | $168,700 |
| 2024 | $3,730 | $302,300 | $133,600 | $168,700 |
| 2023 | $3,583 | $211,500 | $68,600 | $142,900 |
| 2022 | $3,507 | $211,500 | $68,600 | $142,900 |
| 2021 | $3,507 | $211,500 | $68,600 | $142,900 |
| 2020 | $3,574 | $171,100 | $66,000 | $105,100 |
| 2019 | $3,574 | $171,100 | $66,000 | $105,100 |
| 2018 | $3,444 | $171,100 | $66,000 | $105,100 |
| 2017 | $3,349 | $147,400 | $50,700 | $96,700 |
| 2016 | $3,227 | $147,400 | $50,700 | $96,700 |
| 2015 | $3,227 | $147,400 | $50,700 | $96,700 |
| 2014 | $3,263 | $141,500 | $56,400 | $85,100 |
Source: Public Records
Map
Nearby Homes