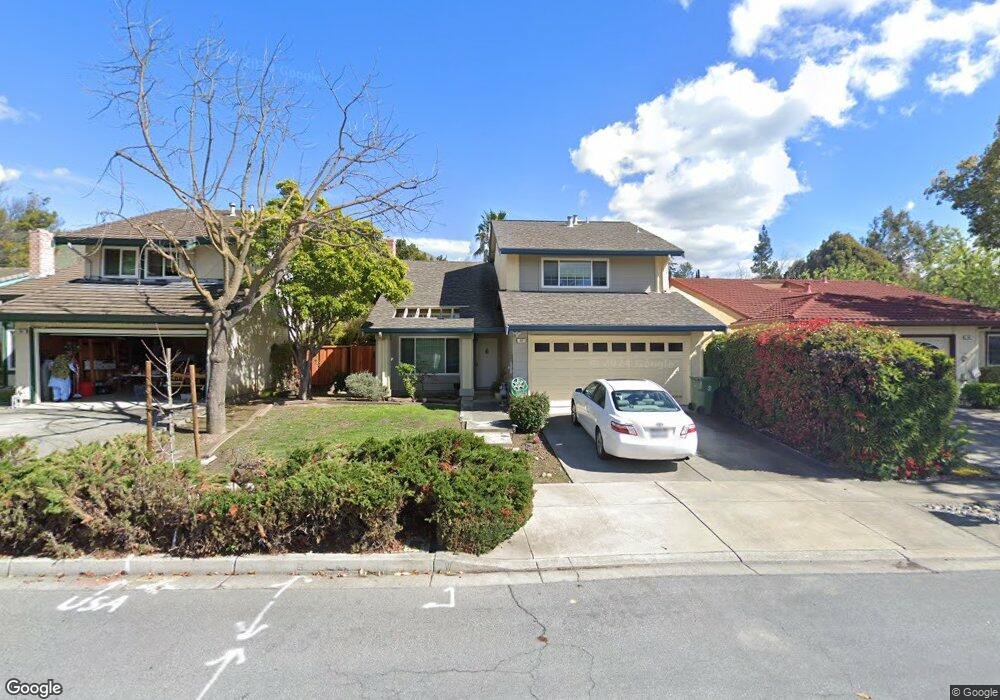
40 Japala Ct Fremont, CA 94539
Weibel NeighborhoodEstimated Value: $1,795,351 - $2,349,000
4
Beds
3
Baths
1,617
Sq Ft
$1,278/Sq Ft
Est. Value
About This Home
This home is located at 40 Japala Ct, Fremont, CA 94539 and is currently estimated at $2,066,338, approximately $1,277 per square foot. 40 Japala Ct is a home located in Alameda County with nearby schools including Fred E. Weibel Elementary School, John M. Horner Junior High School, and Irvington High School.
Ownership History
Date
Name
Owned For
Owner Type
Purchase Details
Closed on
Mar 20, 2018
Sold by
Bhanjois Bhimsen and Bhanjois Sangeeth B
Bought by
Bhanjois Bhimsen and Bhanjois Sangeeth B
Current Estimated Value
Purchase Details
Closed on
Feb 23, 2010
Sold by
Cartwright Eric B and Cartwright Ann K
Bought by
Bhanjois Bhimsen and Bhanjois Sangeeth
Home Financials for this Owner
Home Financials are based on the most recent Mortgage that was taken out on this home.
Original Mortgage
$628,000
Outstanding Balance
$415,630
Interest Rate
5.03%
Mortgage Type
New Conventional
Estimated Equity
$1,650,708
Purchase Details
Closed on
Jul 22, 1999
Sold by
Taber David O and Weiss Jennifer J
Bought by
Cartwright Eric B and Cartwright Ann K
Home Financials for this Owner
Home Financials are based on the most recent Mortgage that was taken out on this home.
Original Mortgage
$340,000
Interest Rate
6.62%
Create a Home Valuation Report for This Property
The Home Valuation Report is an in-depth analysis detailing your home's value as well as a comparison with similar homes in the area
Home Values in the Area
Average Home Value in this Area
Purchase History
| Date | Buyer | Sale Price | Title Company |
|---|---|---|---|
| Bhanjois Bhimsen | -- | None Available | |
| Bhanjois Bhimsen | $785,000 | Cornerstone Title Company | |
| Cartwright Eric B | $425,000 | Old Republic Title Company |
Source: Public Records
Mortgage History
| Date | Status | Borrower | Loan Amount |
|---|---|---|---|
| Open | Bhanjois Bhimsen | $628,000 | |
| Previous Owner | Cartwright Eric B | $340,000 |
Source: Public Records
Tax History Compared to Growth
Tax History
| Year | Tax Paid | Tax Assessment Tax Assessment Total Assessment is a certain percentage of the fair market value that is determined by local assessors to be the total taxable value of land and additions on the property. | Land | Improvement |
|---|---|---|---|---|
| 2025 | $12,000 | $1,006,222 | $303,966 | $709,256 |
| 2024 | $12,000 | $986,361 | $298,008 | $695,353 |
| 2023 | $11,682 | $973,886 | $292,166 | $681,720 |
| 2022 | $11,537 | $947,794 | $286,438 | $668,356 |
| 2021 | $11,252 | $929,080 | $280,824 | $655,256 |
| 2020 | $11,304 | $926,487 | $277,946 | $648,541 |
| 2019 | $11,173 | $908,323 | $272,497 | $635,826 |
| 2018 | $10,955 | $890,518 | $267,155 | $623,363 |
| 2017 | $10,681 | $873,060 | $261,918 | $611,142 |
| 2016 | $10,502 | $855,947 | $256,784 | $599,163 |
| 2015 | $10,365 | $843,097 | $252,929 | $590,168 |
| 2014 | $10,189 | $826,588 | $247,976 | $578,612 |
Source: Public Records
Map
Nearby Homes
- 379 Felipe Common
- 44423 View Point Cir
- 44989 Vista Del Sol
- 1910 Vinehill Cir
- 44916 Winding Ln
- 646 Bella Vista Ct
- 45897 Bridgeport Place
- 130 Kootenai Dr
- 45258 Tom Blalock St Unit 100
- 1748 Kilowatt Way Unit 301
- 483 Becado Place
- 43555 Puesta Del Sol
- 45128 Warm Springs Blvd Unit 323
- 45128 Warm Springs Blvd Unit 523
- 43547 Ellsworth St
- 2250 Kilowatt Way Unit 214
- 42099 Vinha Way
- 2450 Euclid Place
- 905 Glenhill Dr
- 341 Dana St
- 30 Japala Ct
- 50 Japala Ct
- 44658 Japala Place
- 20 Japala Ct
- 44668 Japala Place
- 45 Japala Ct
- 35 Japala Ct
- 10 Japala Ct
- 55 Japala Ct
- 25 Japala Ct
- 44643 Japala Place
- 44633 Japala Place
- 44678 Japala Place
- 44653 Japala Place
- 15 Japala Ct
- 44623 Japala Place
- 44663 Japala Place
- 44613 Japala Place
- 44548 Japala Place
- 44538 Japala Place